
Founder, Comcent
Call Graph Demonstration
In this comprehensive guide, we will explore the call graphs in Comcent Call Center Software. Call graphs provide invaluable insights into a single call, enabling you to optimize operations effectively.
Please watch the video above to understand how call graphs works. Go through below for textual guide.****
For call center managers, examining call center logs alone may not provide sufficient insights. Understanding the complete journey of a call offers deeper analytical value.
In Comcent, you can access this functionality through the call story menu.
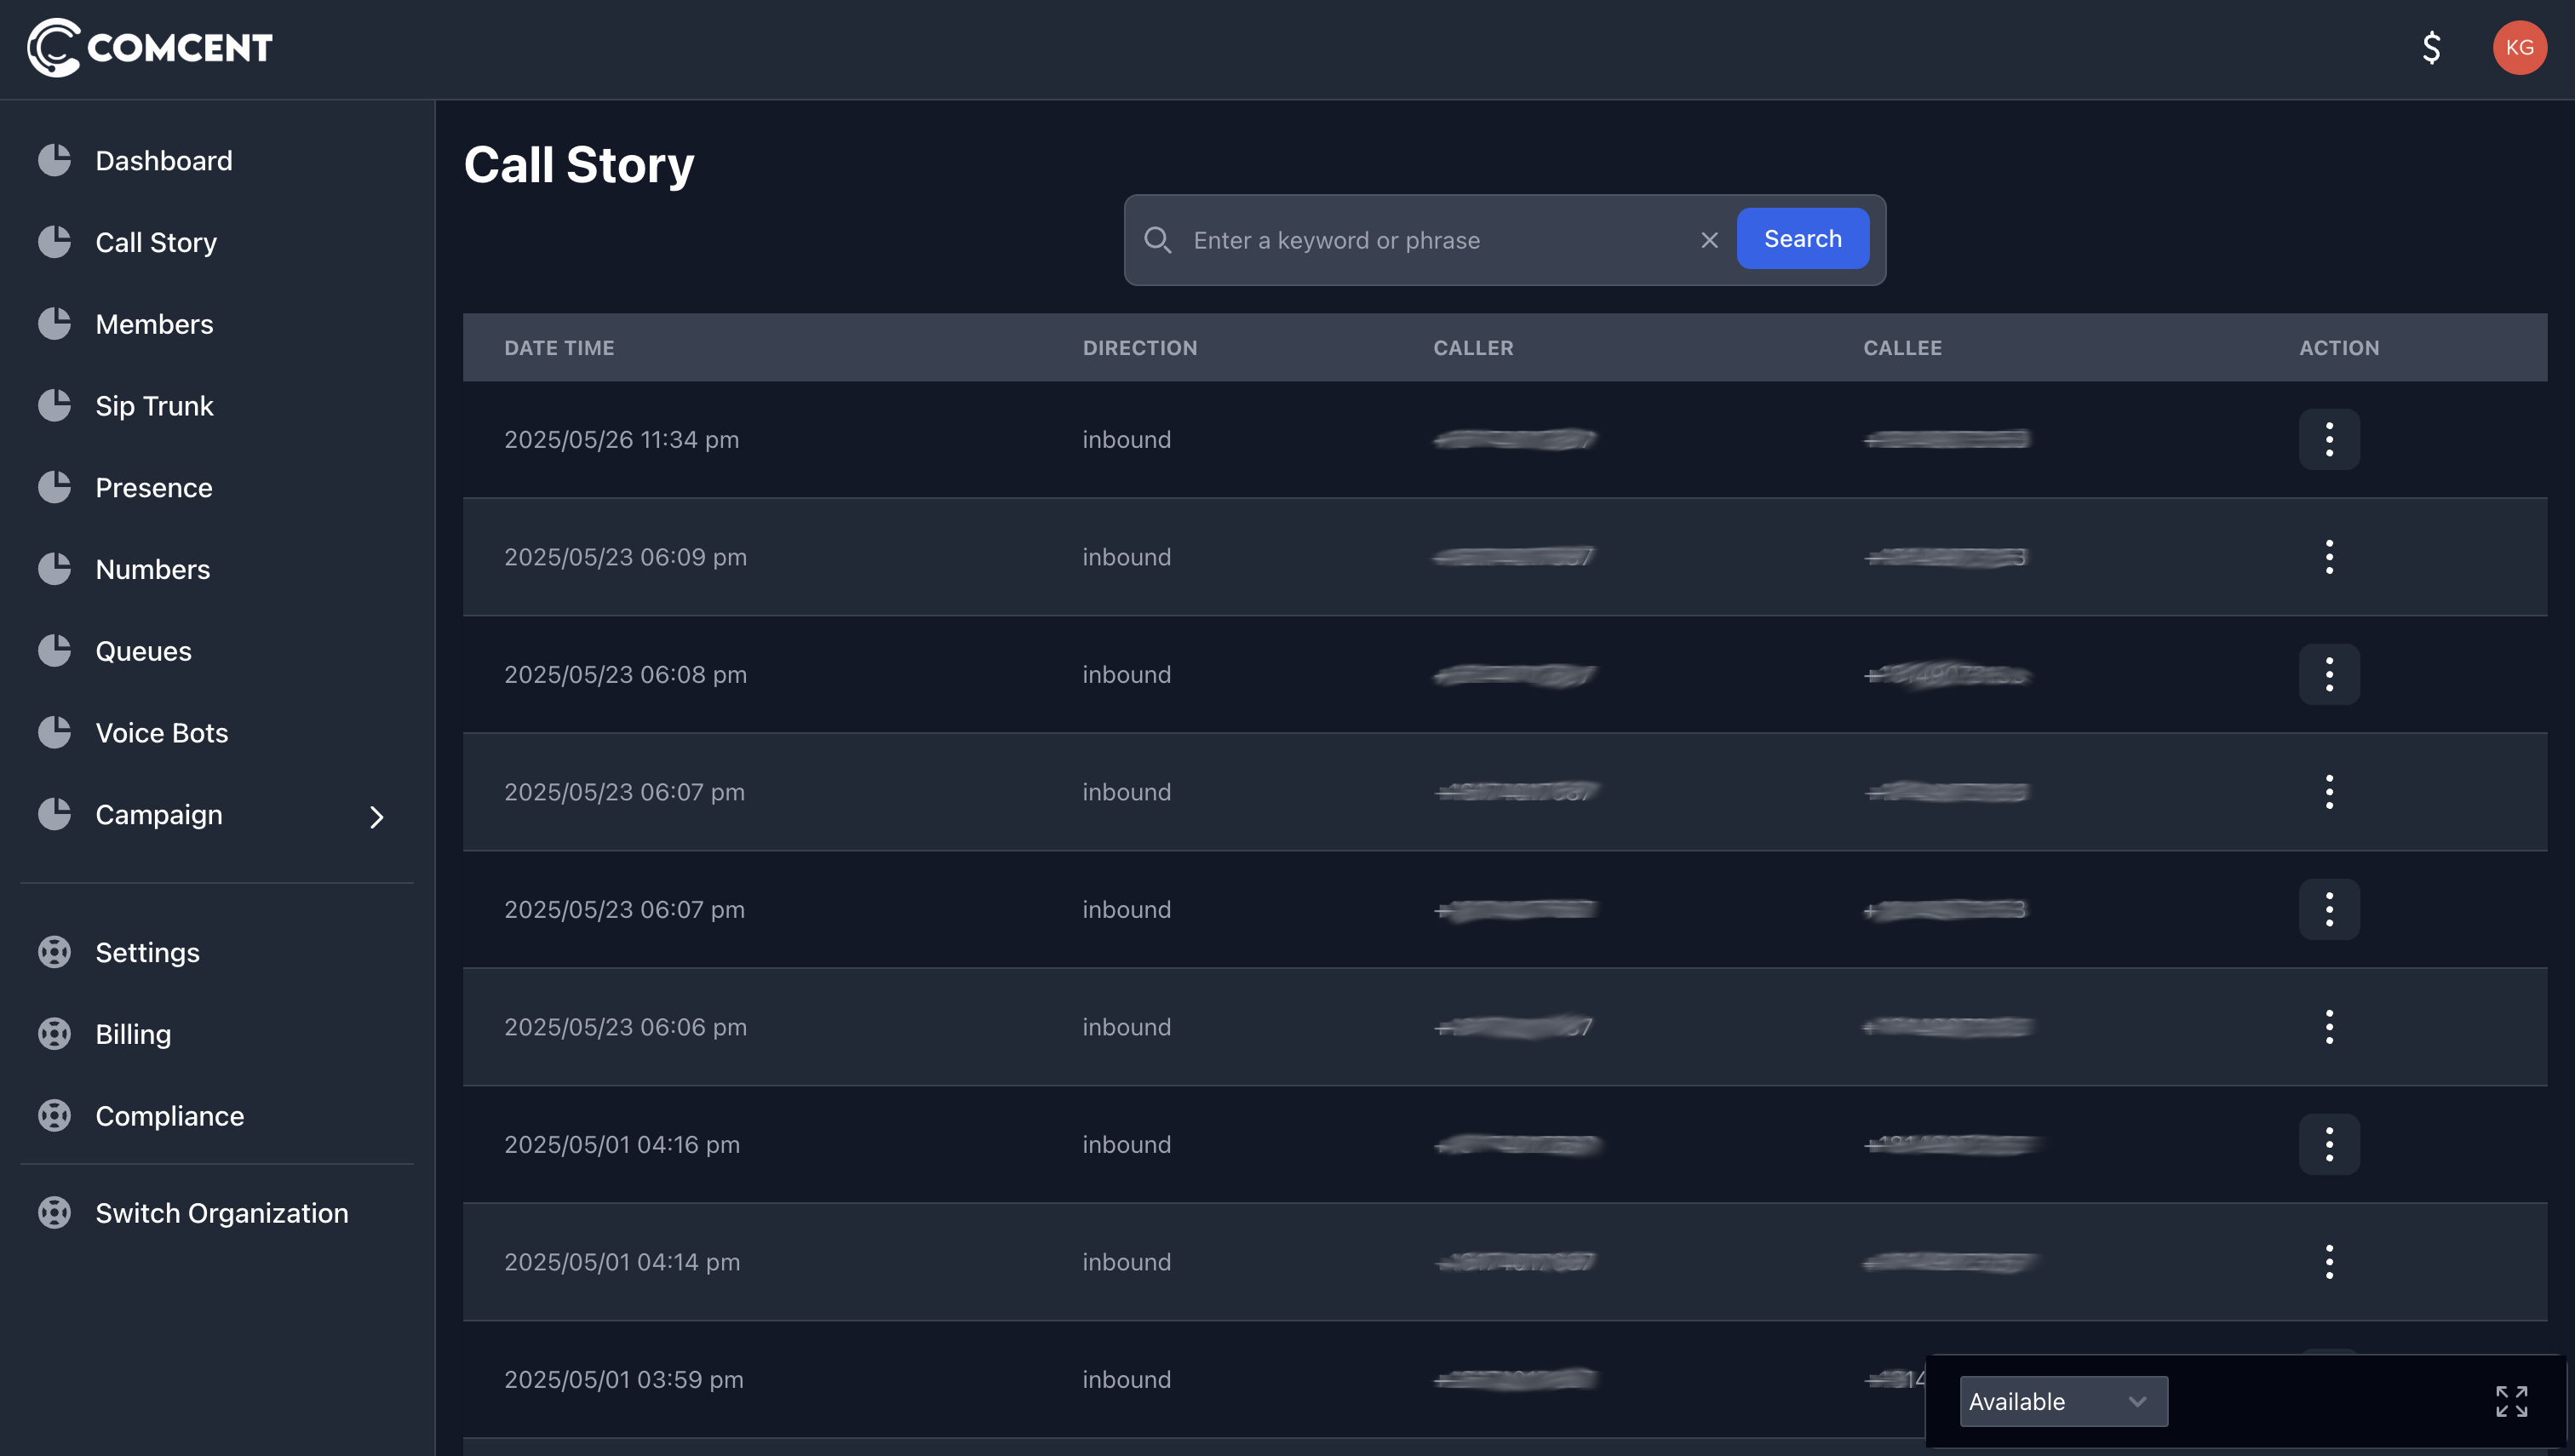
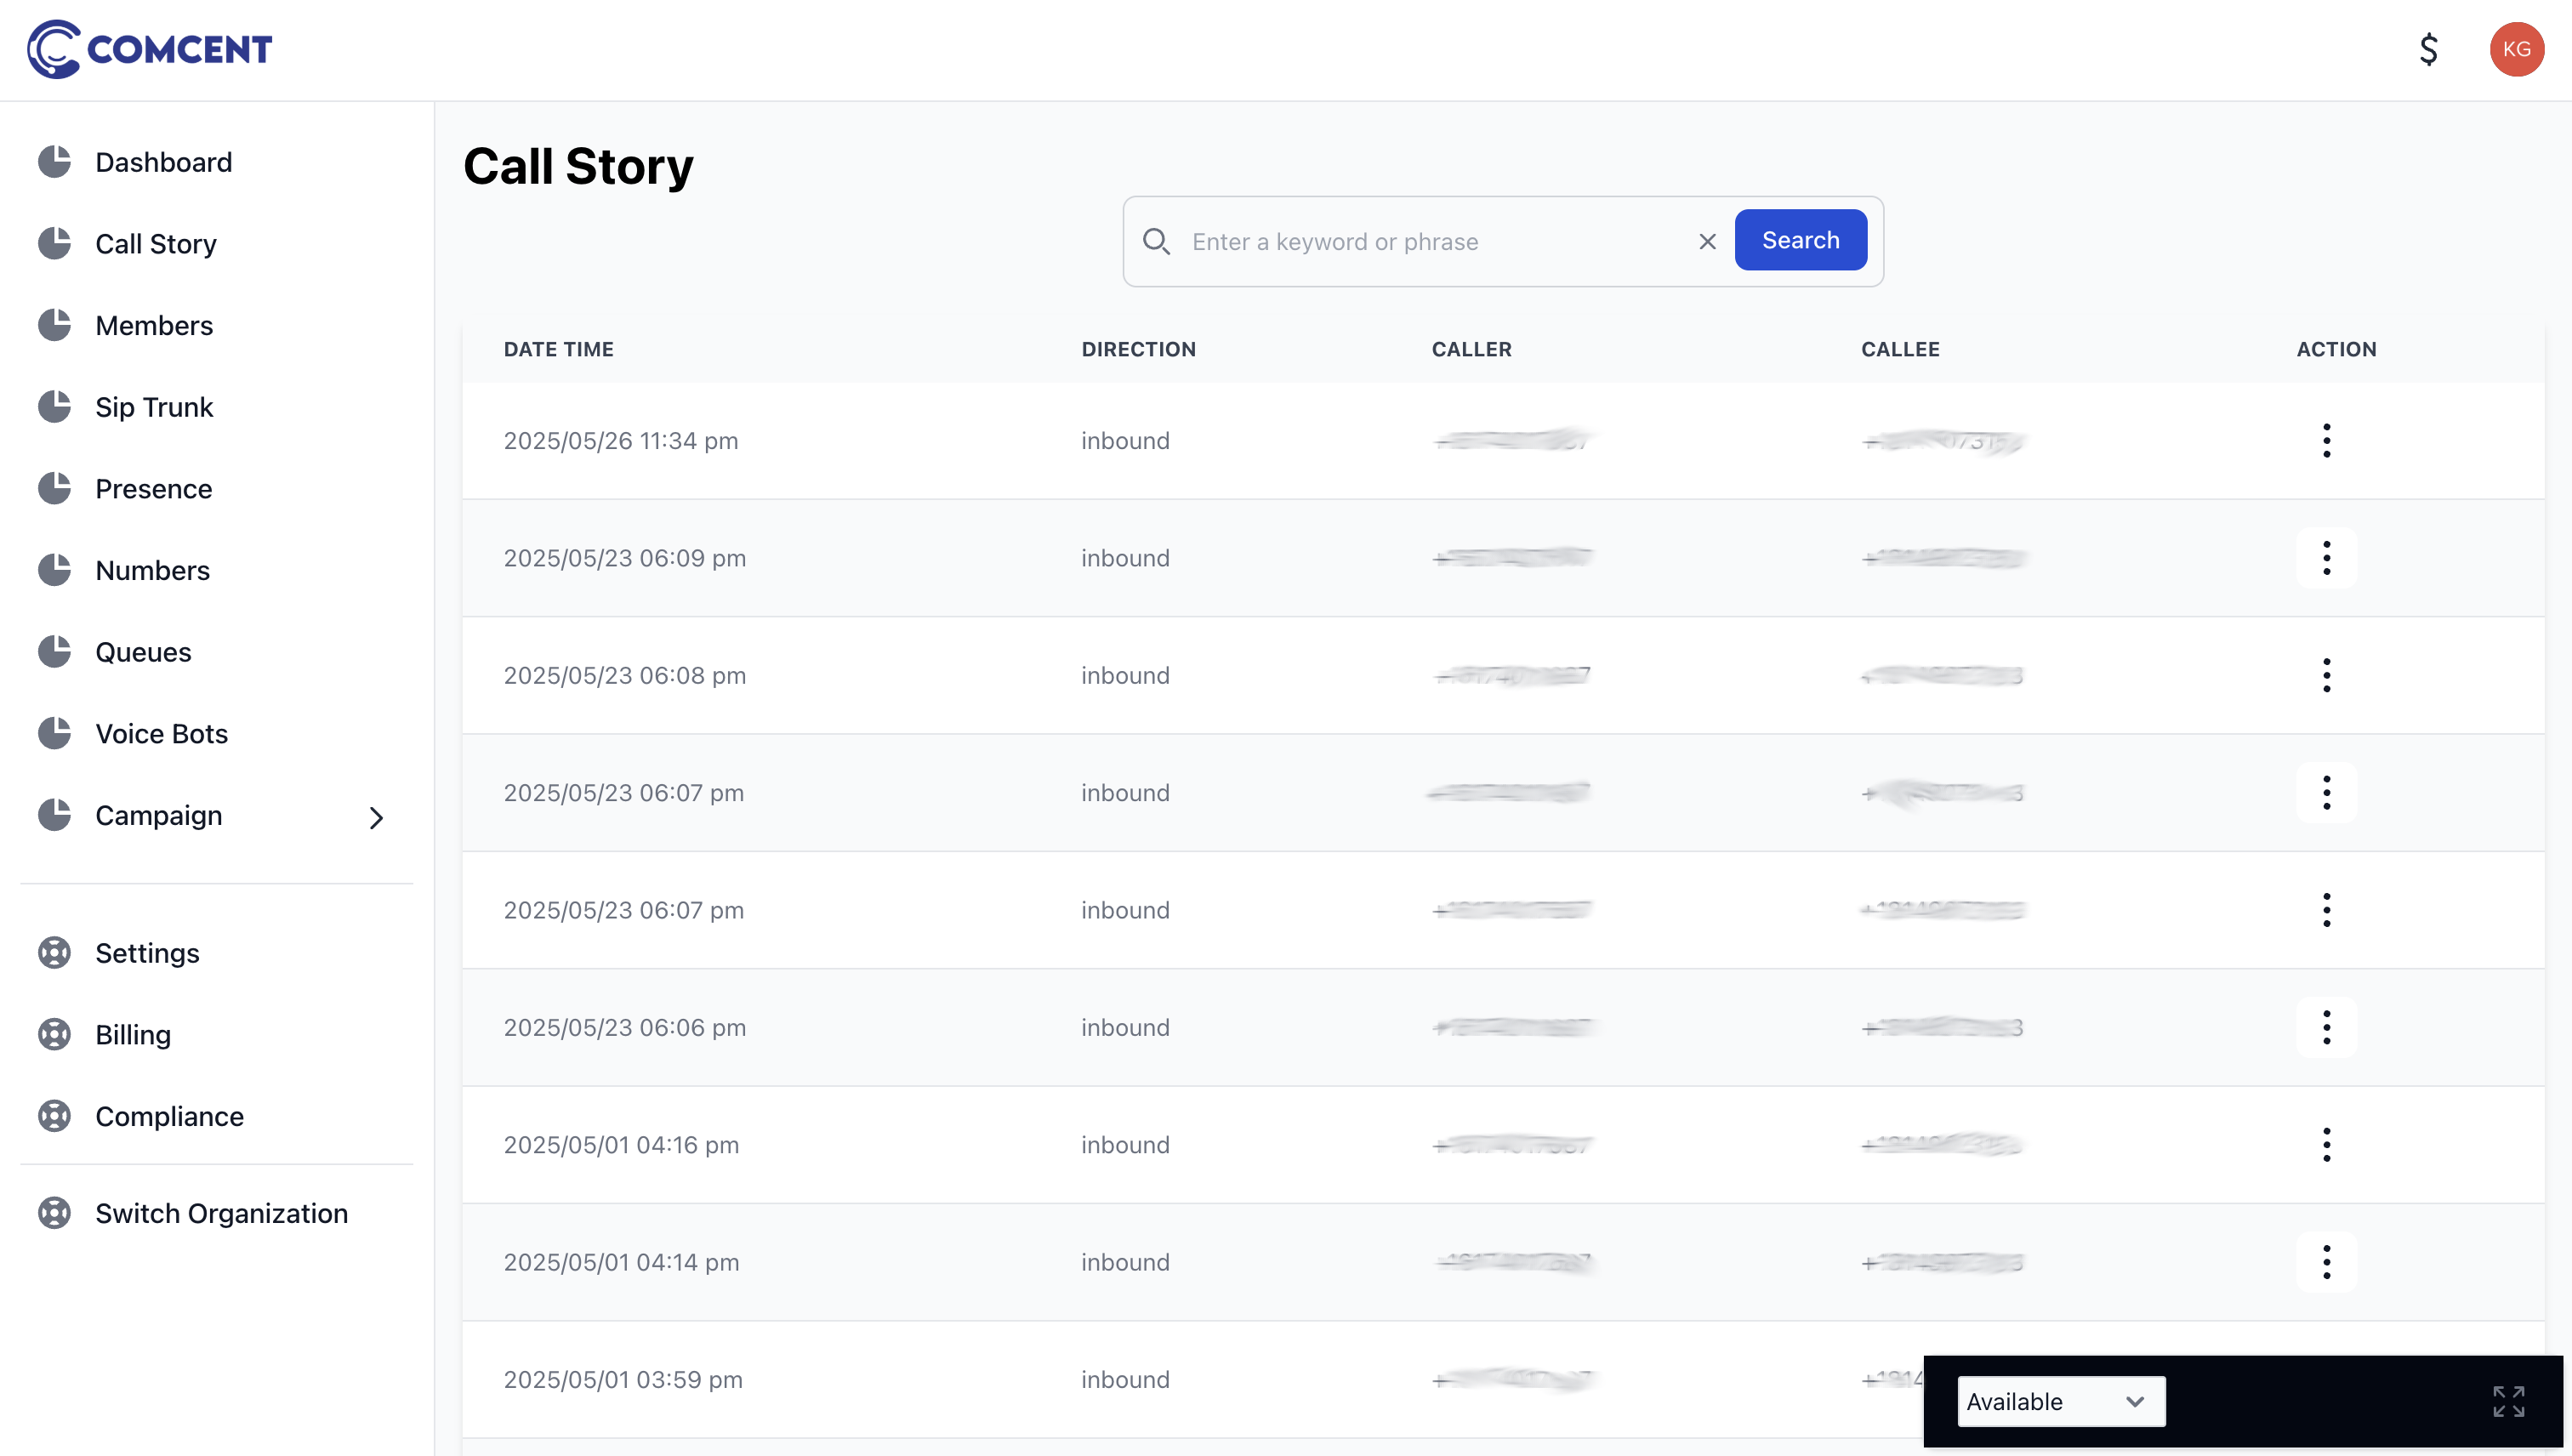
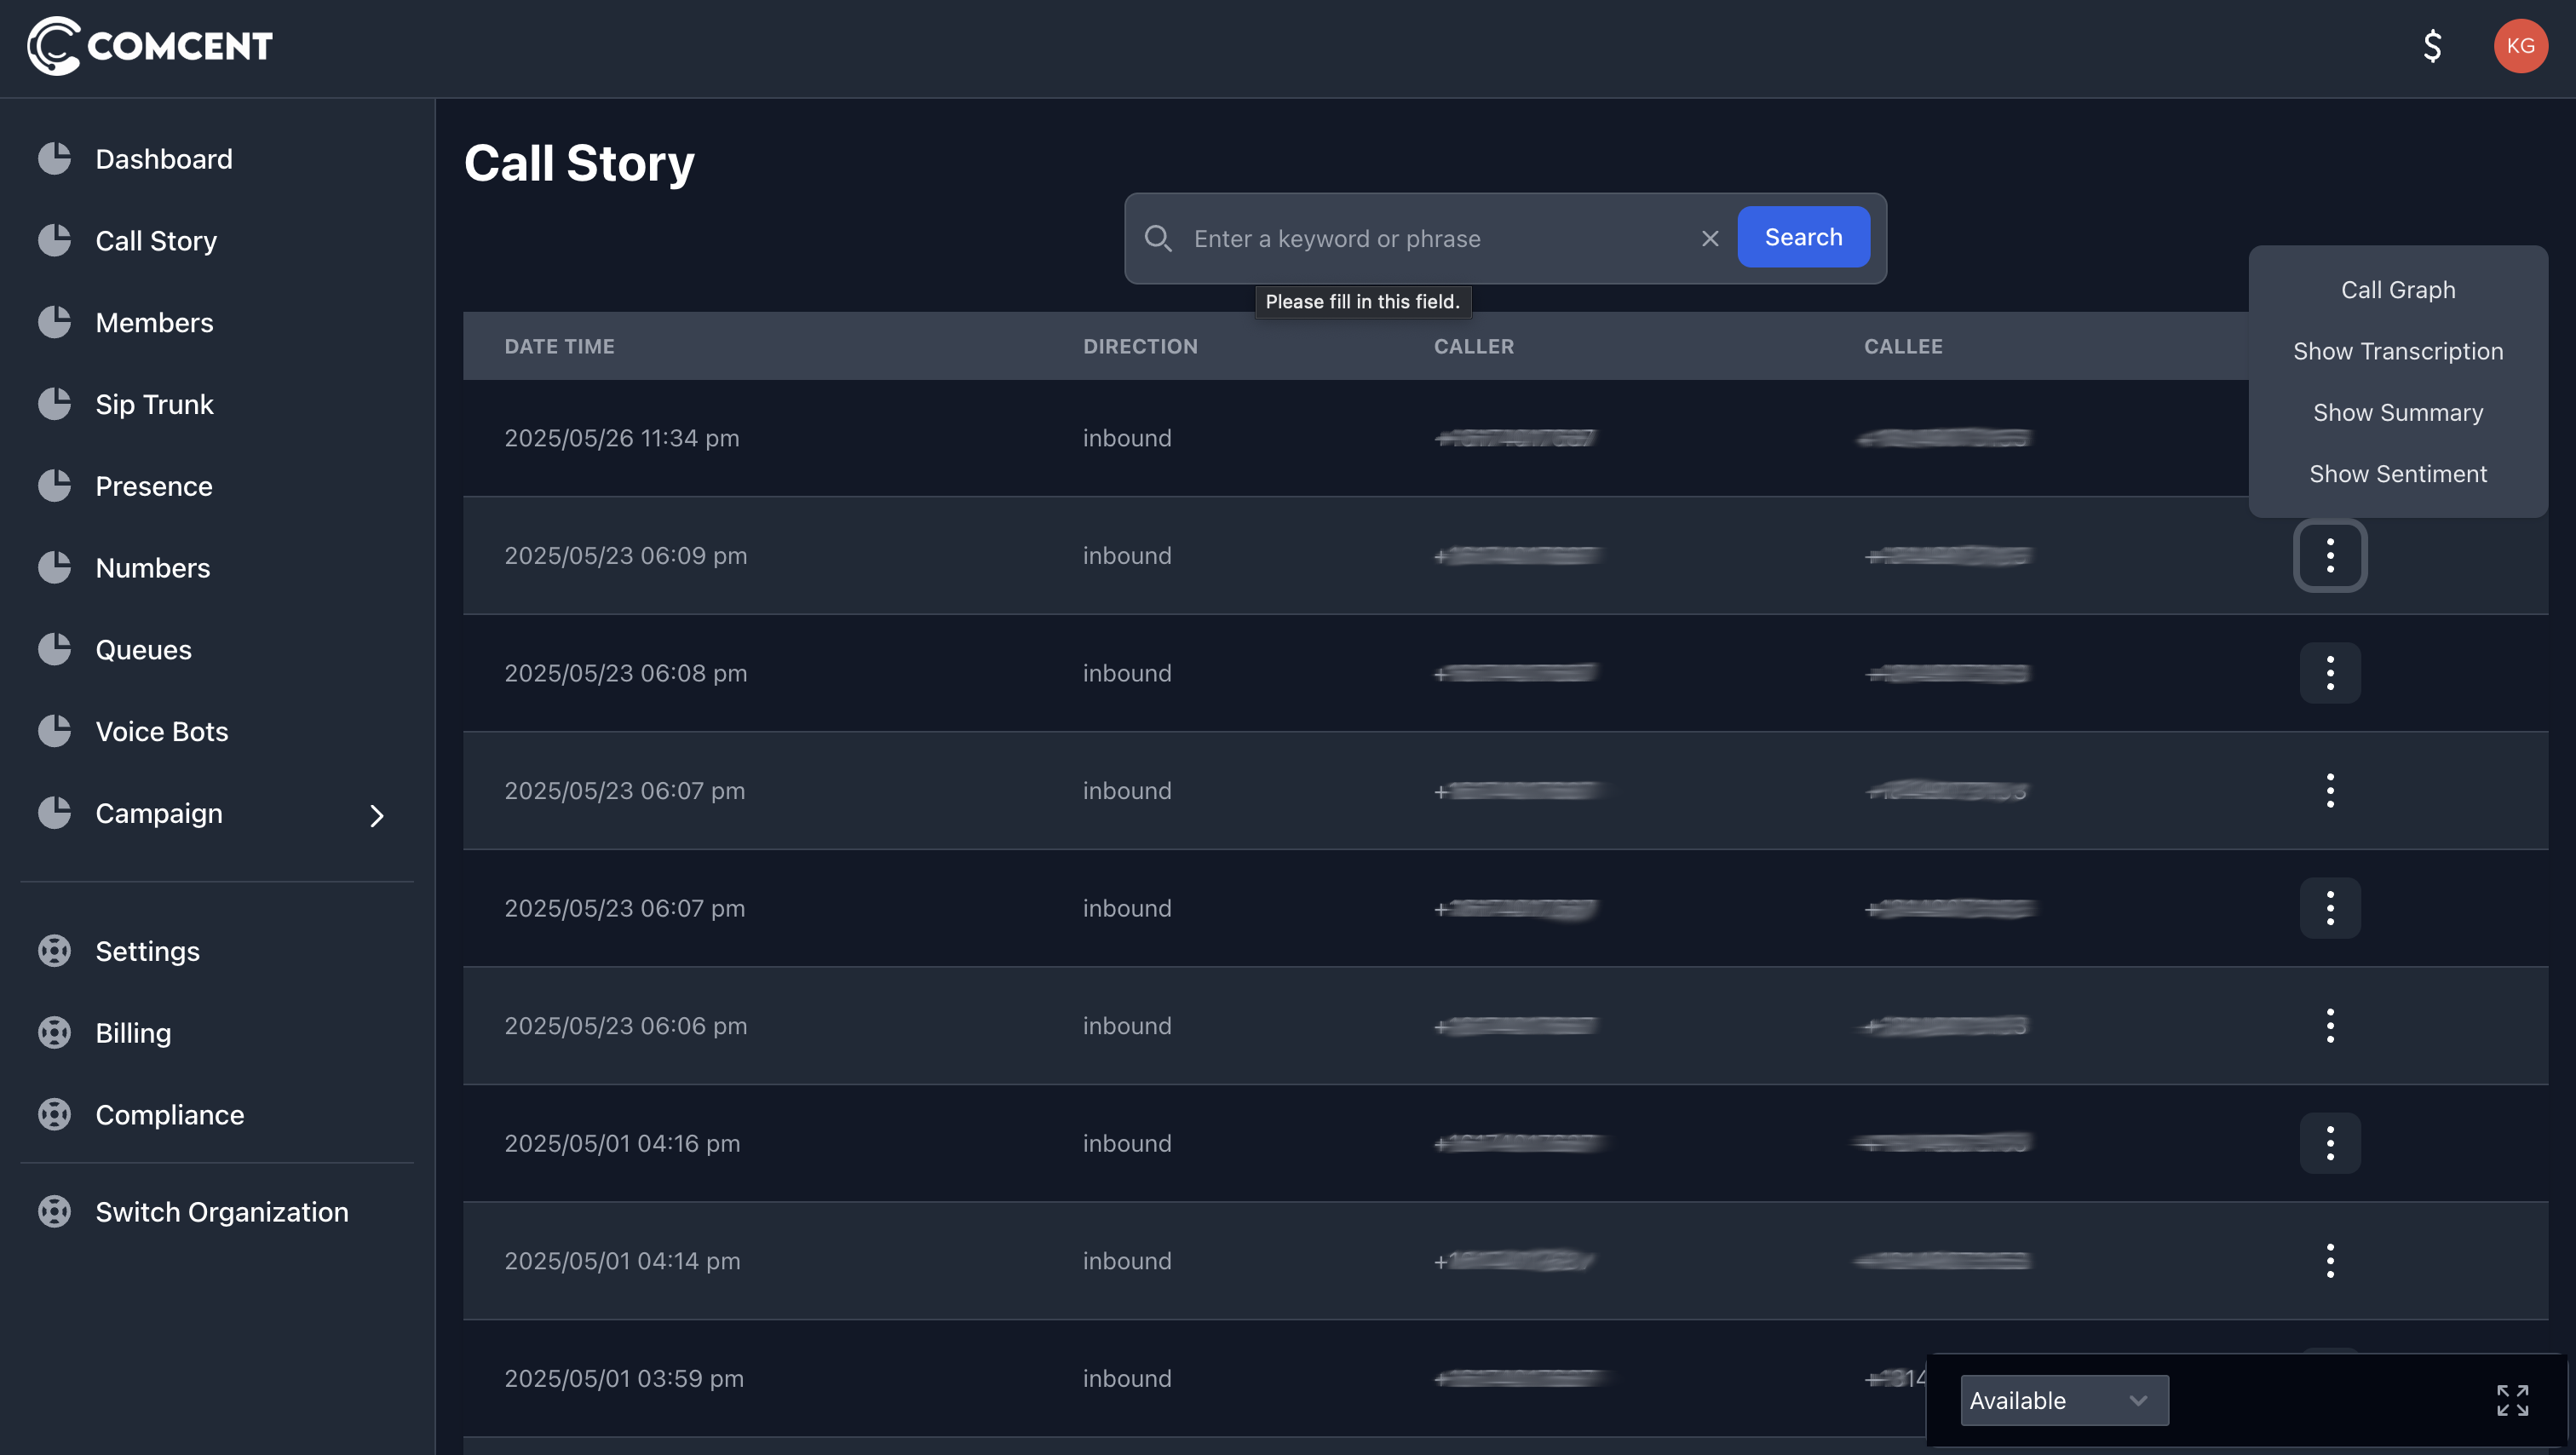
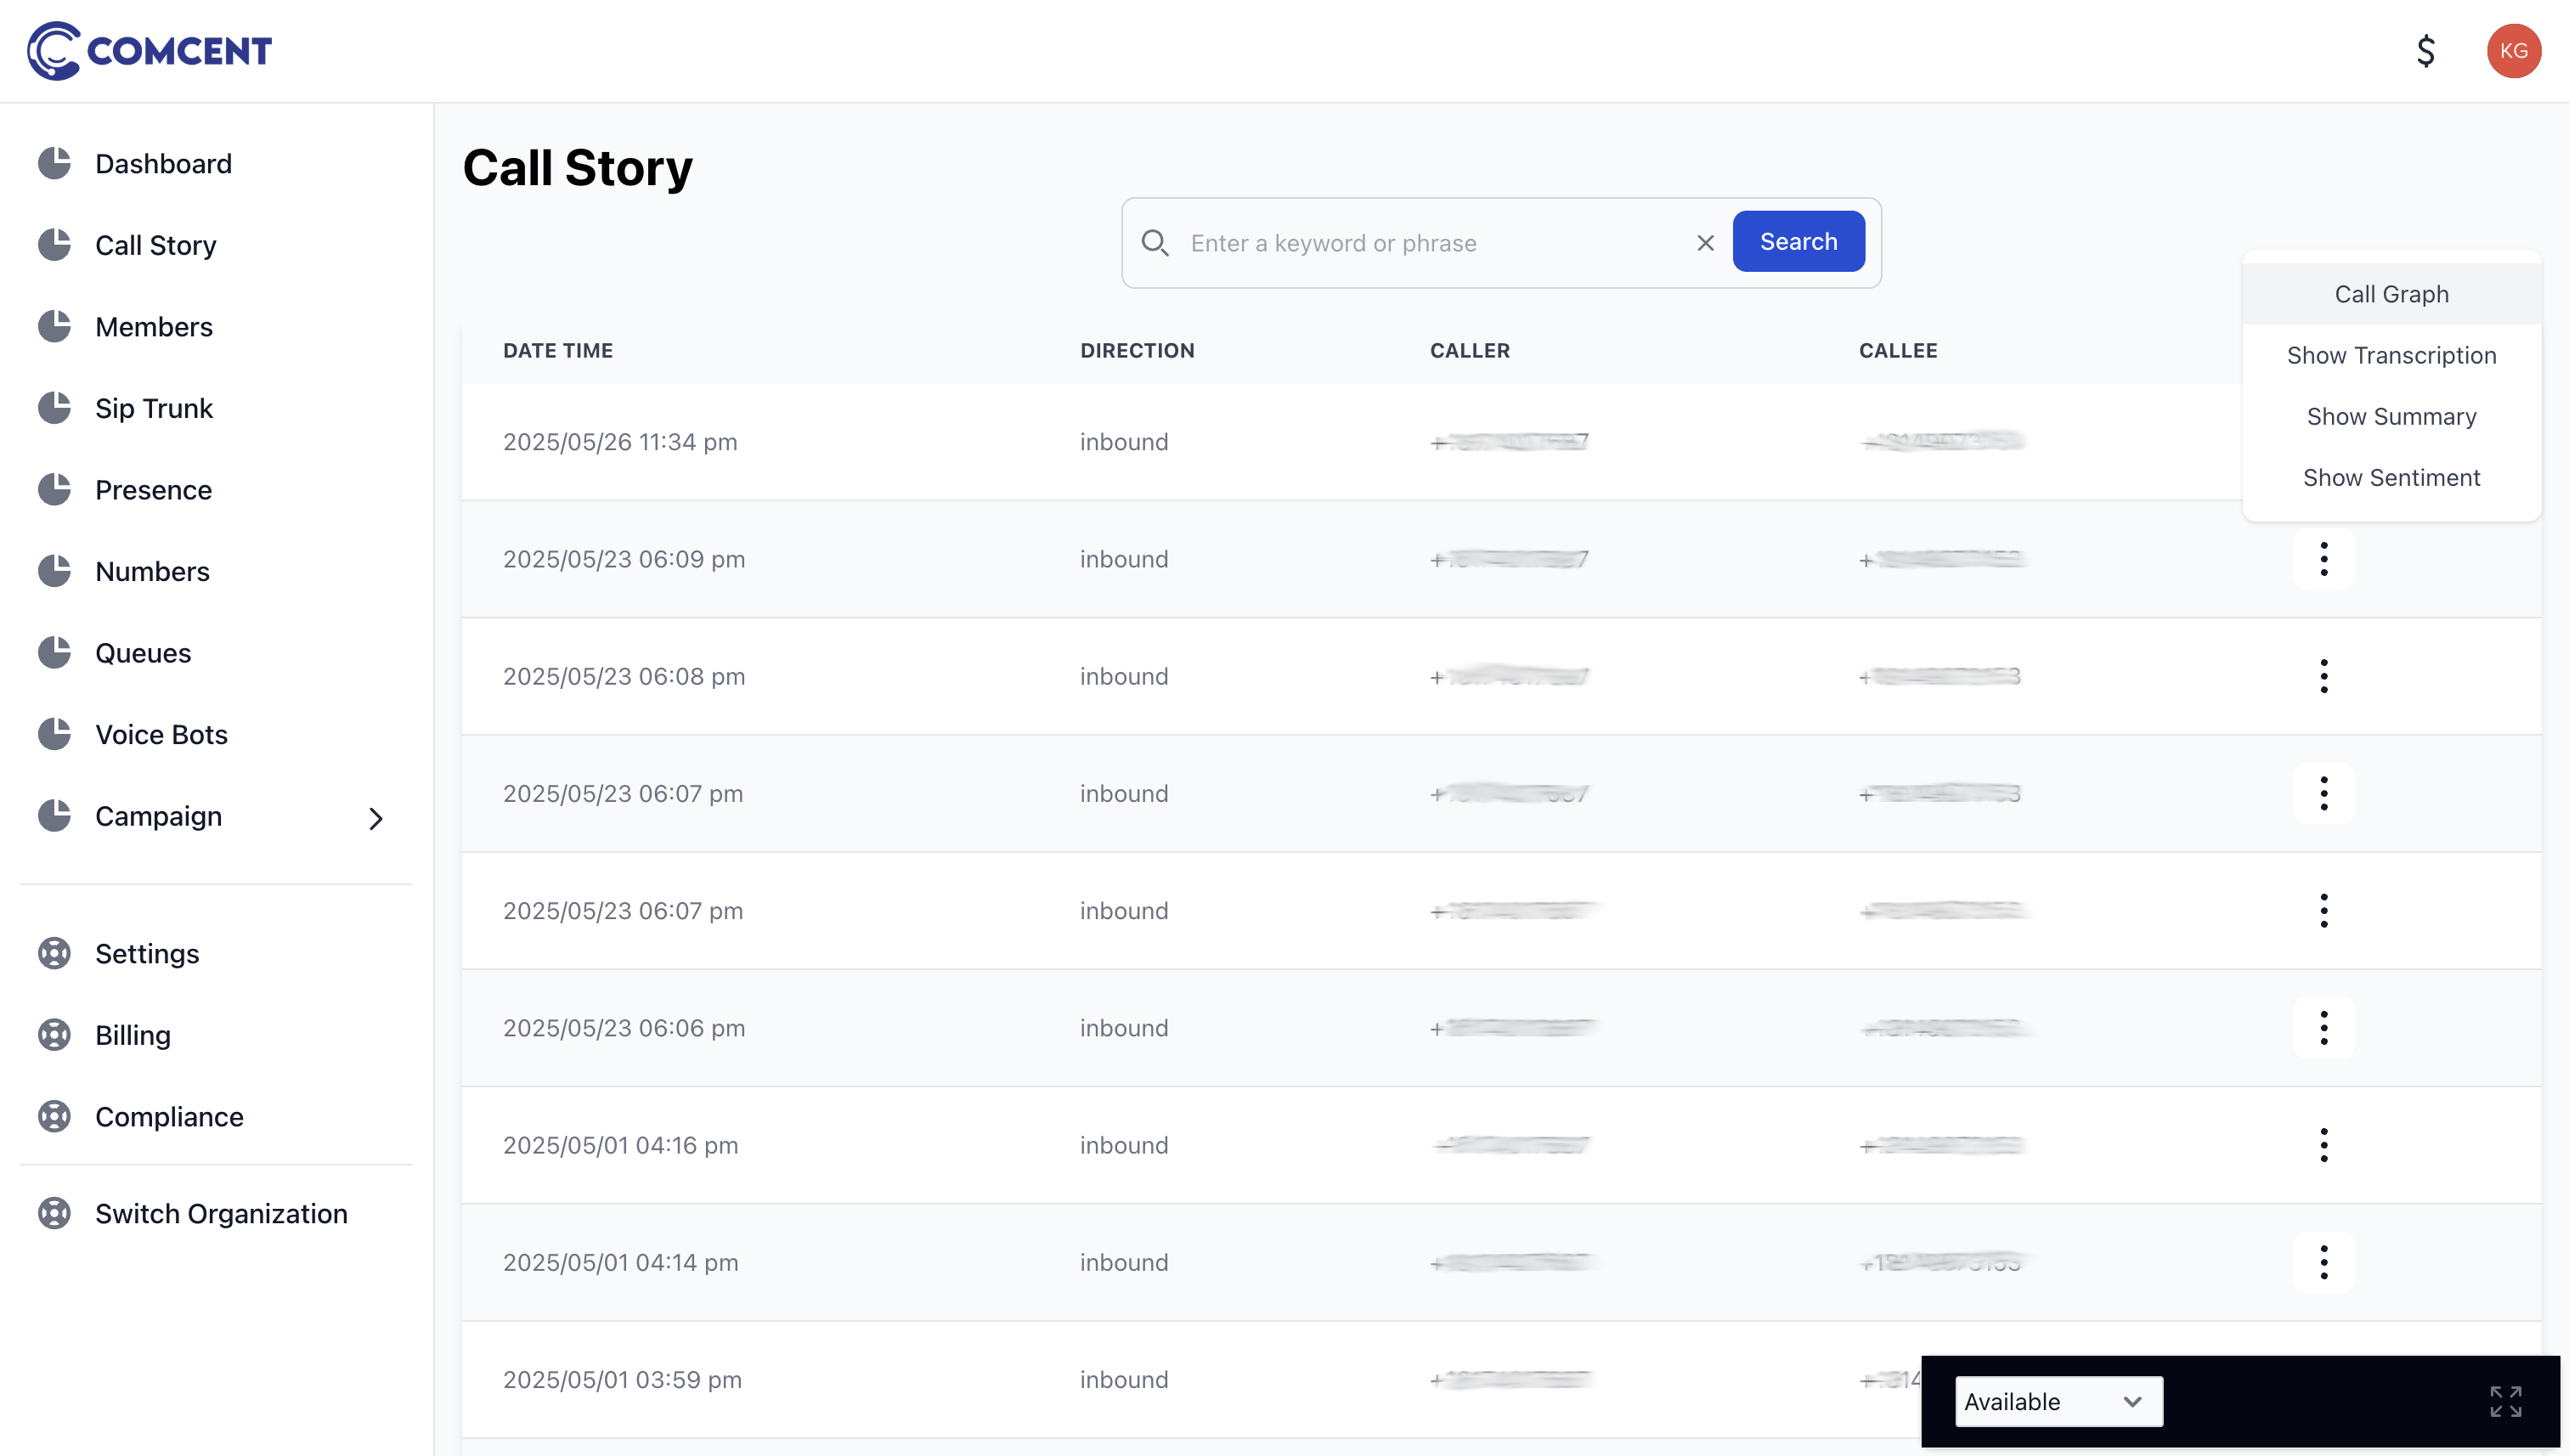
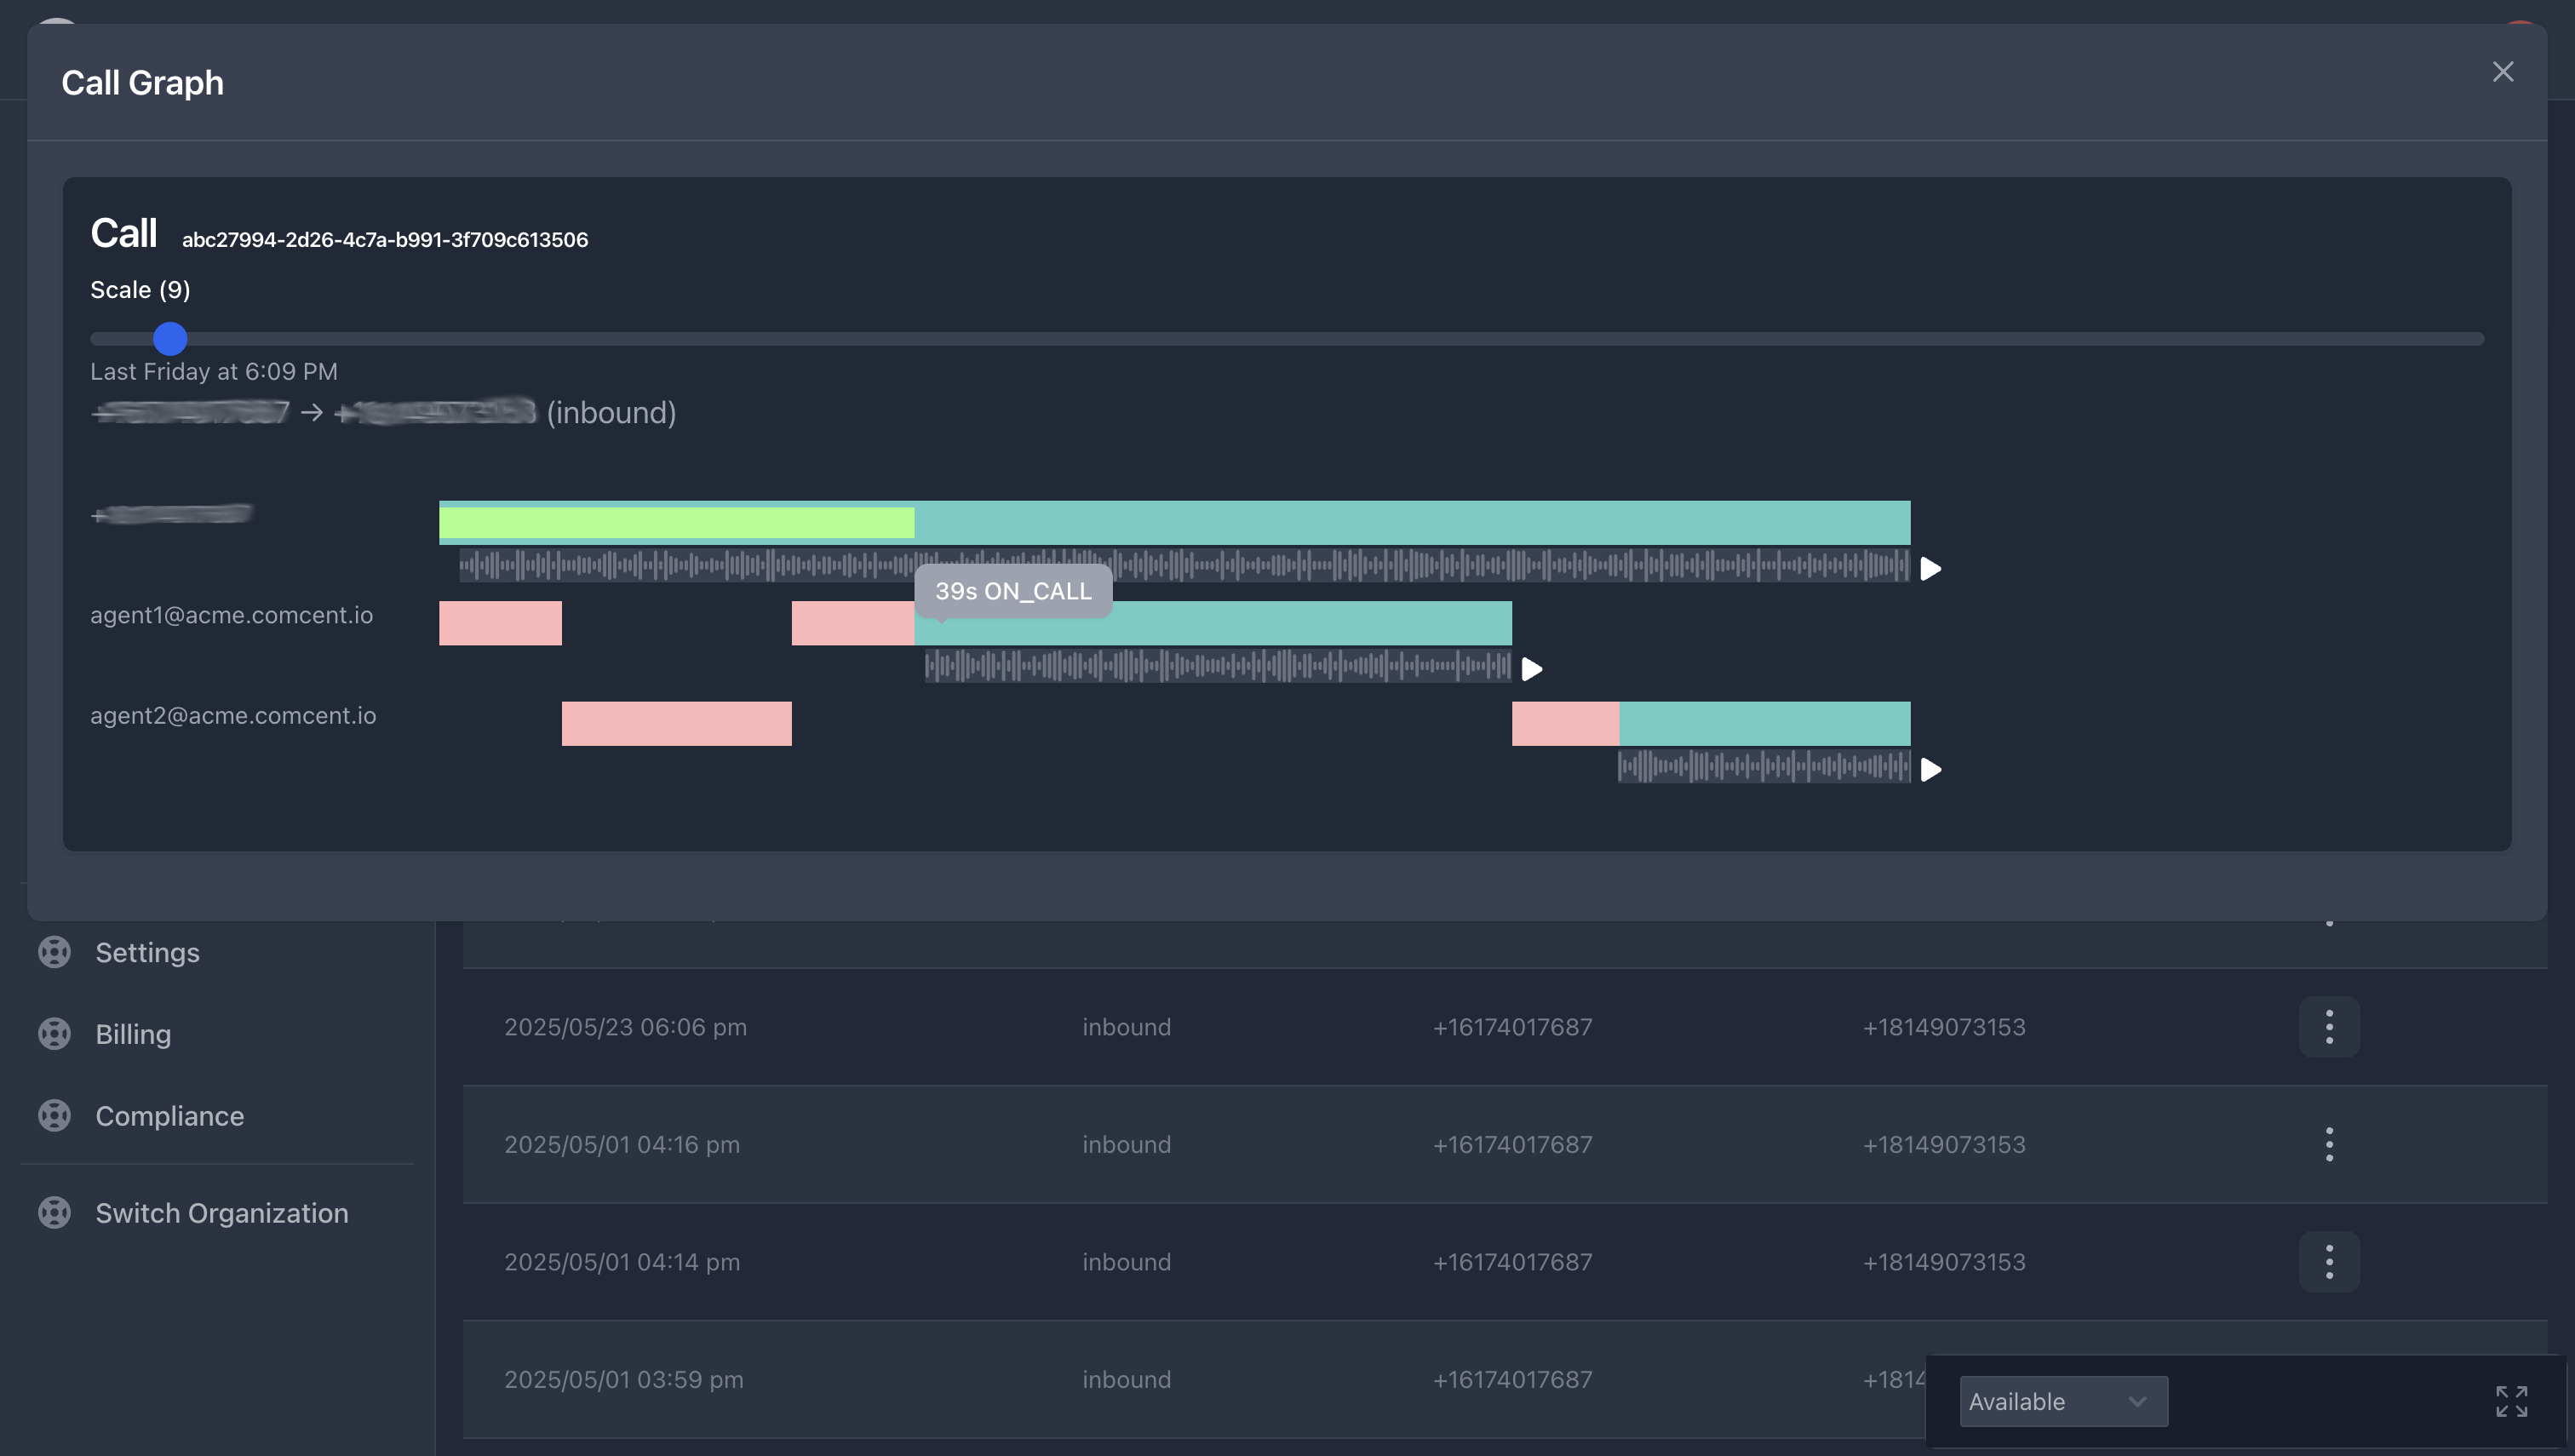
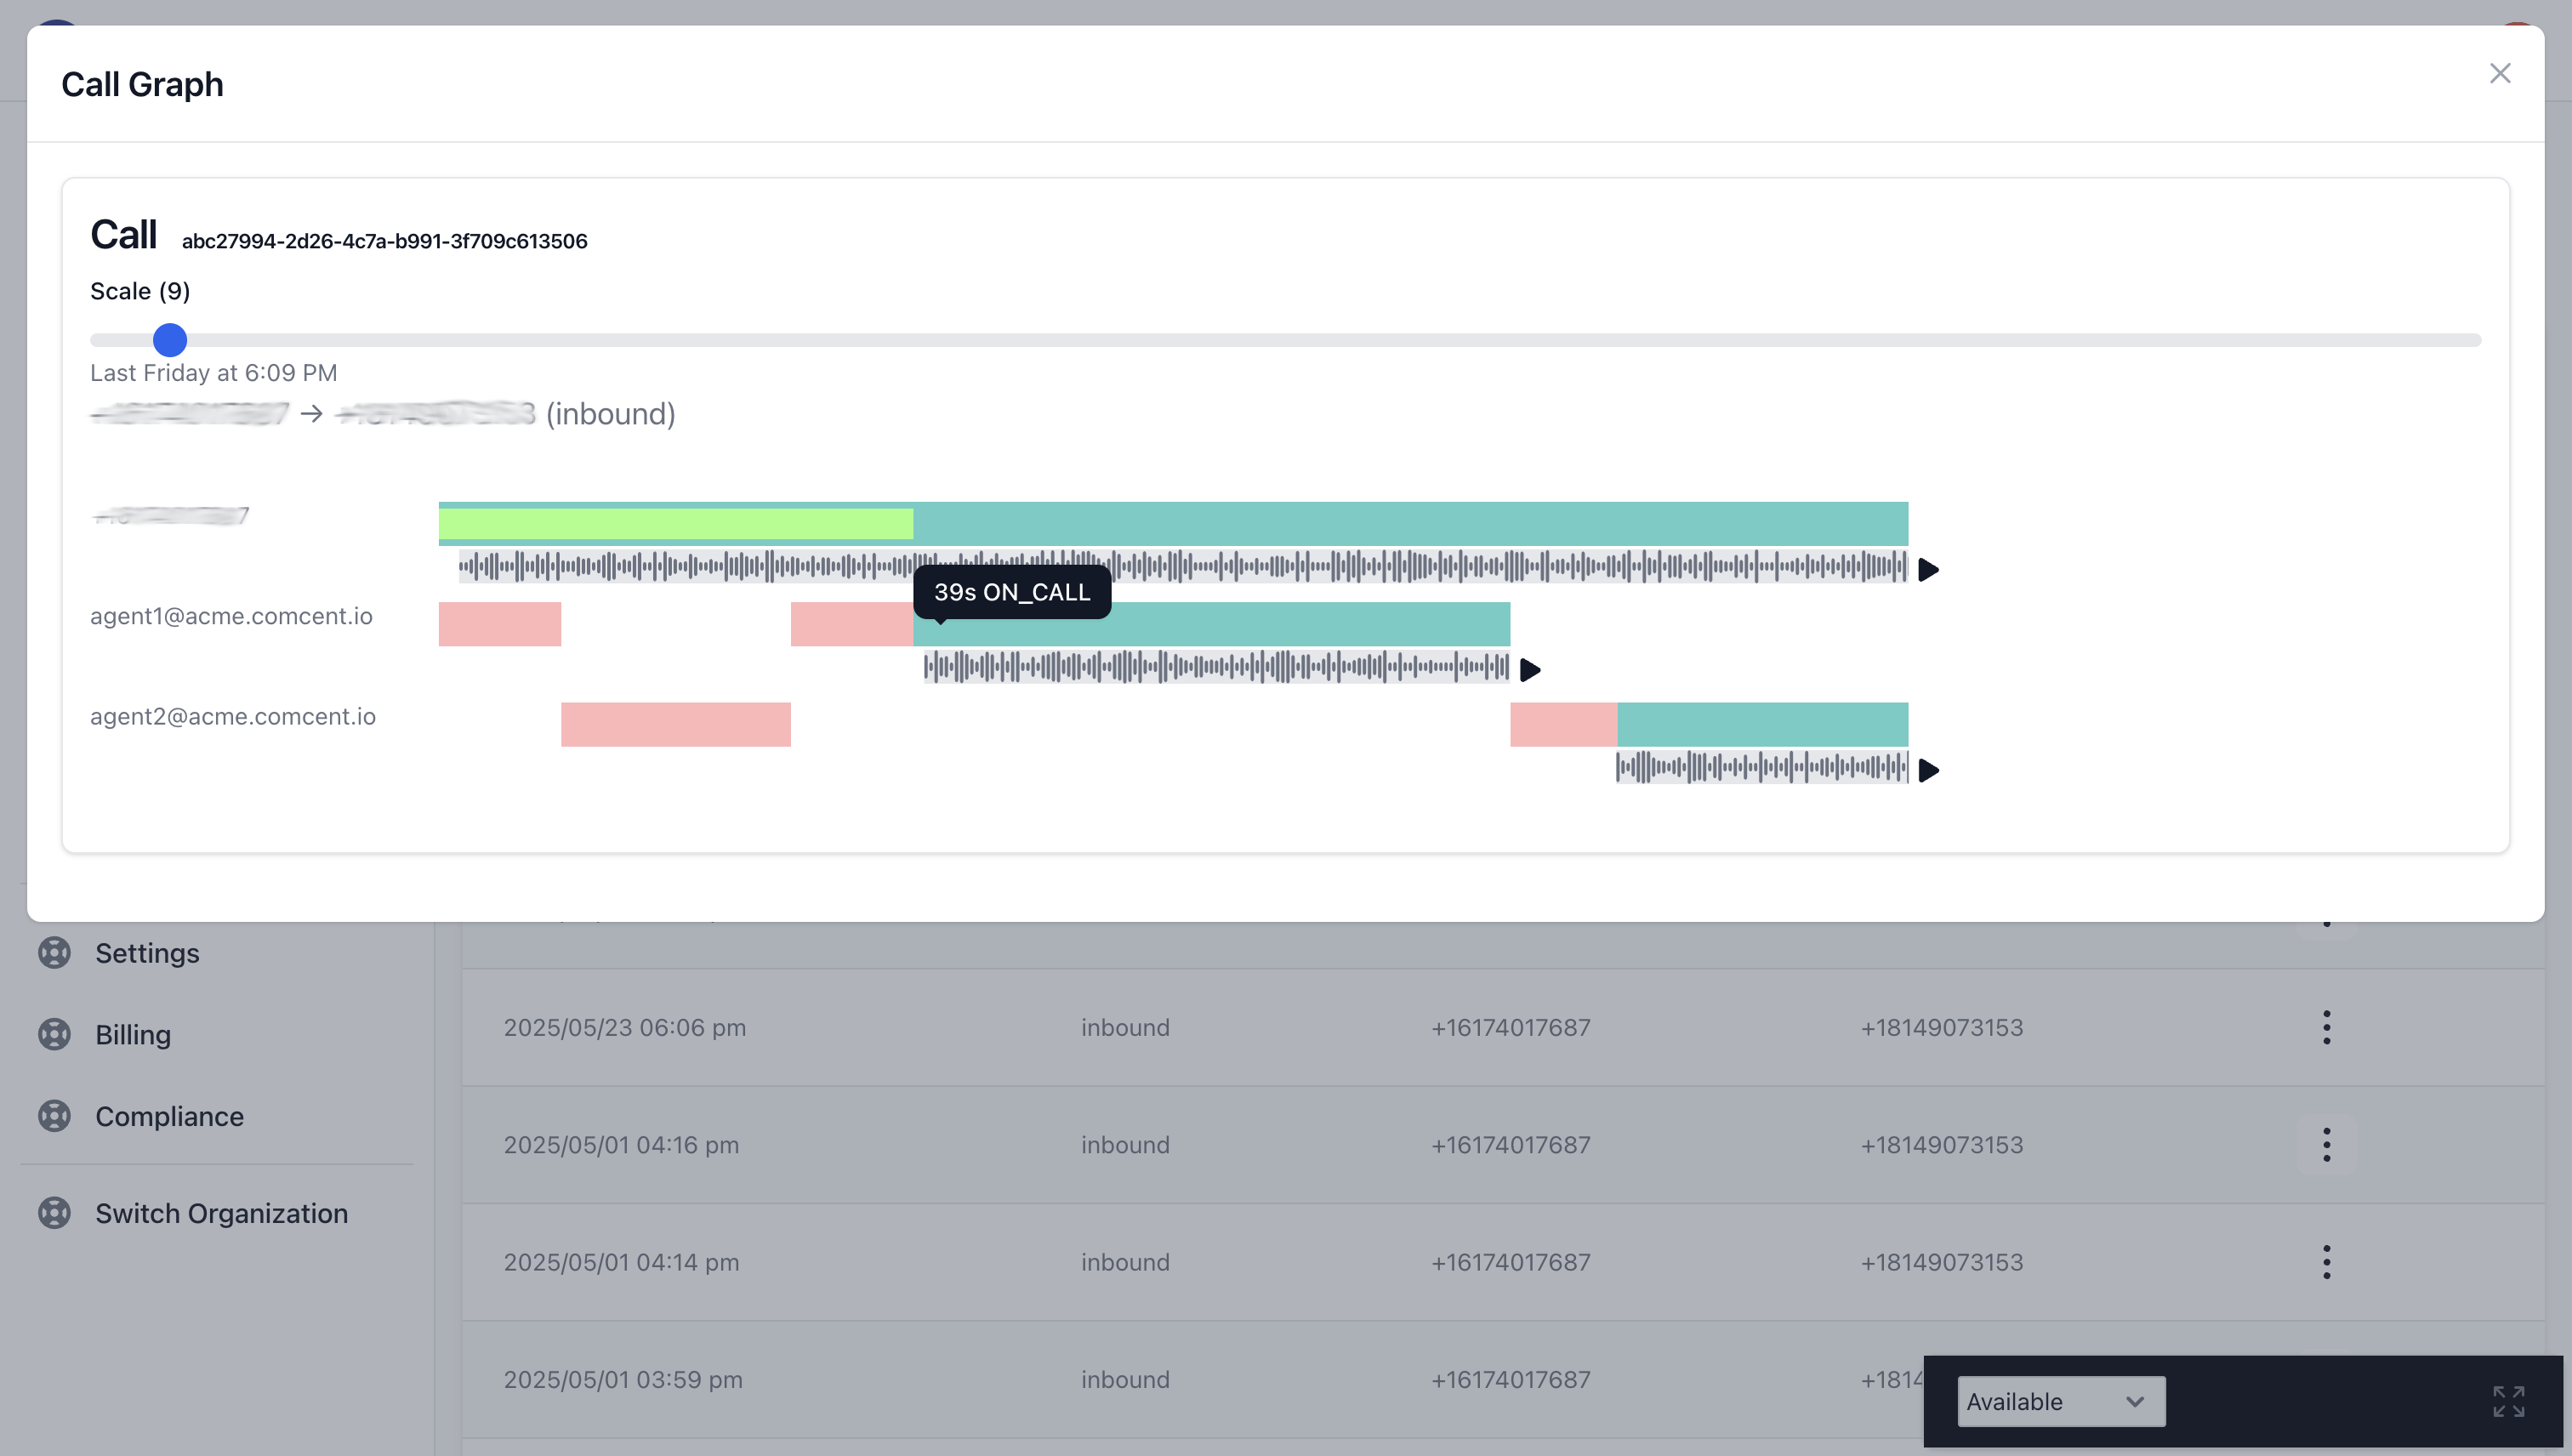
To analyze a specific call, click the action button and select “call graph.” This action opens a comprehensive visual timeline of the call’s journey.
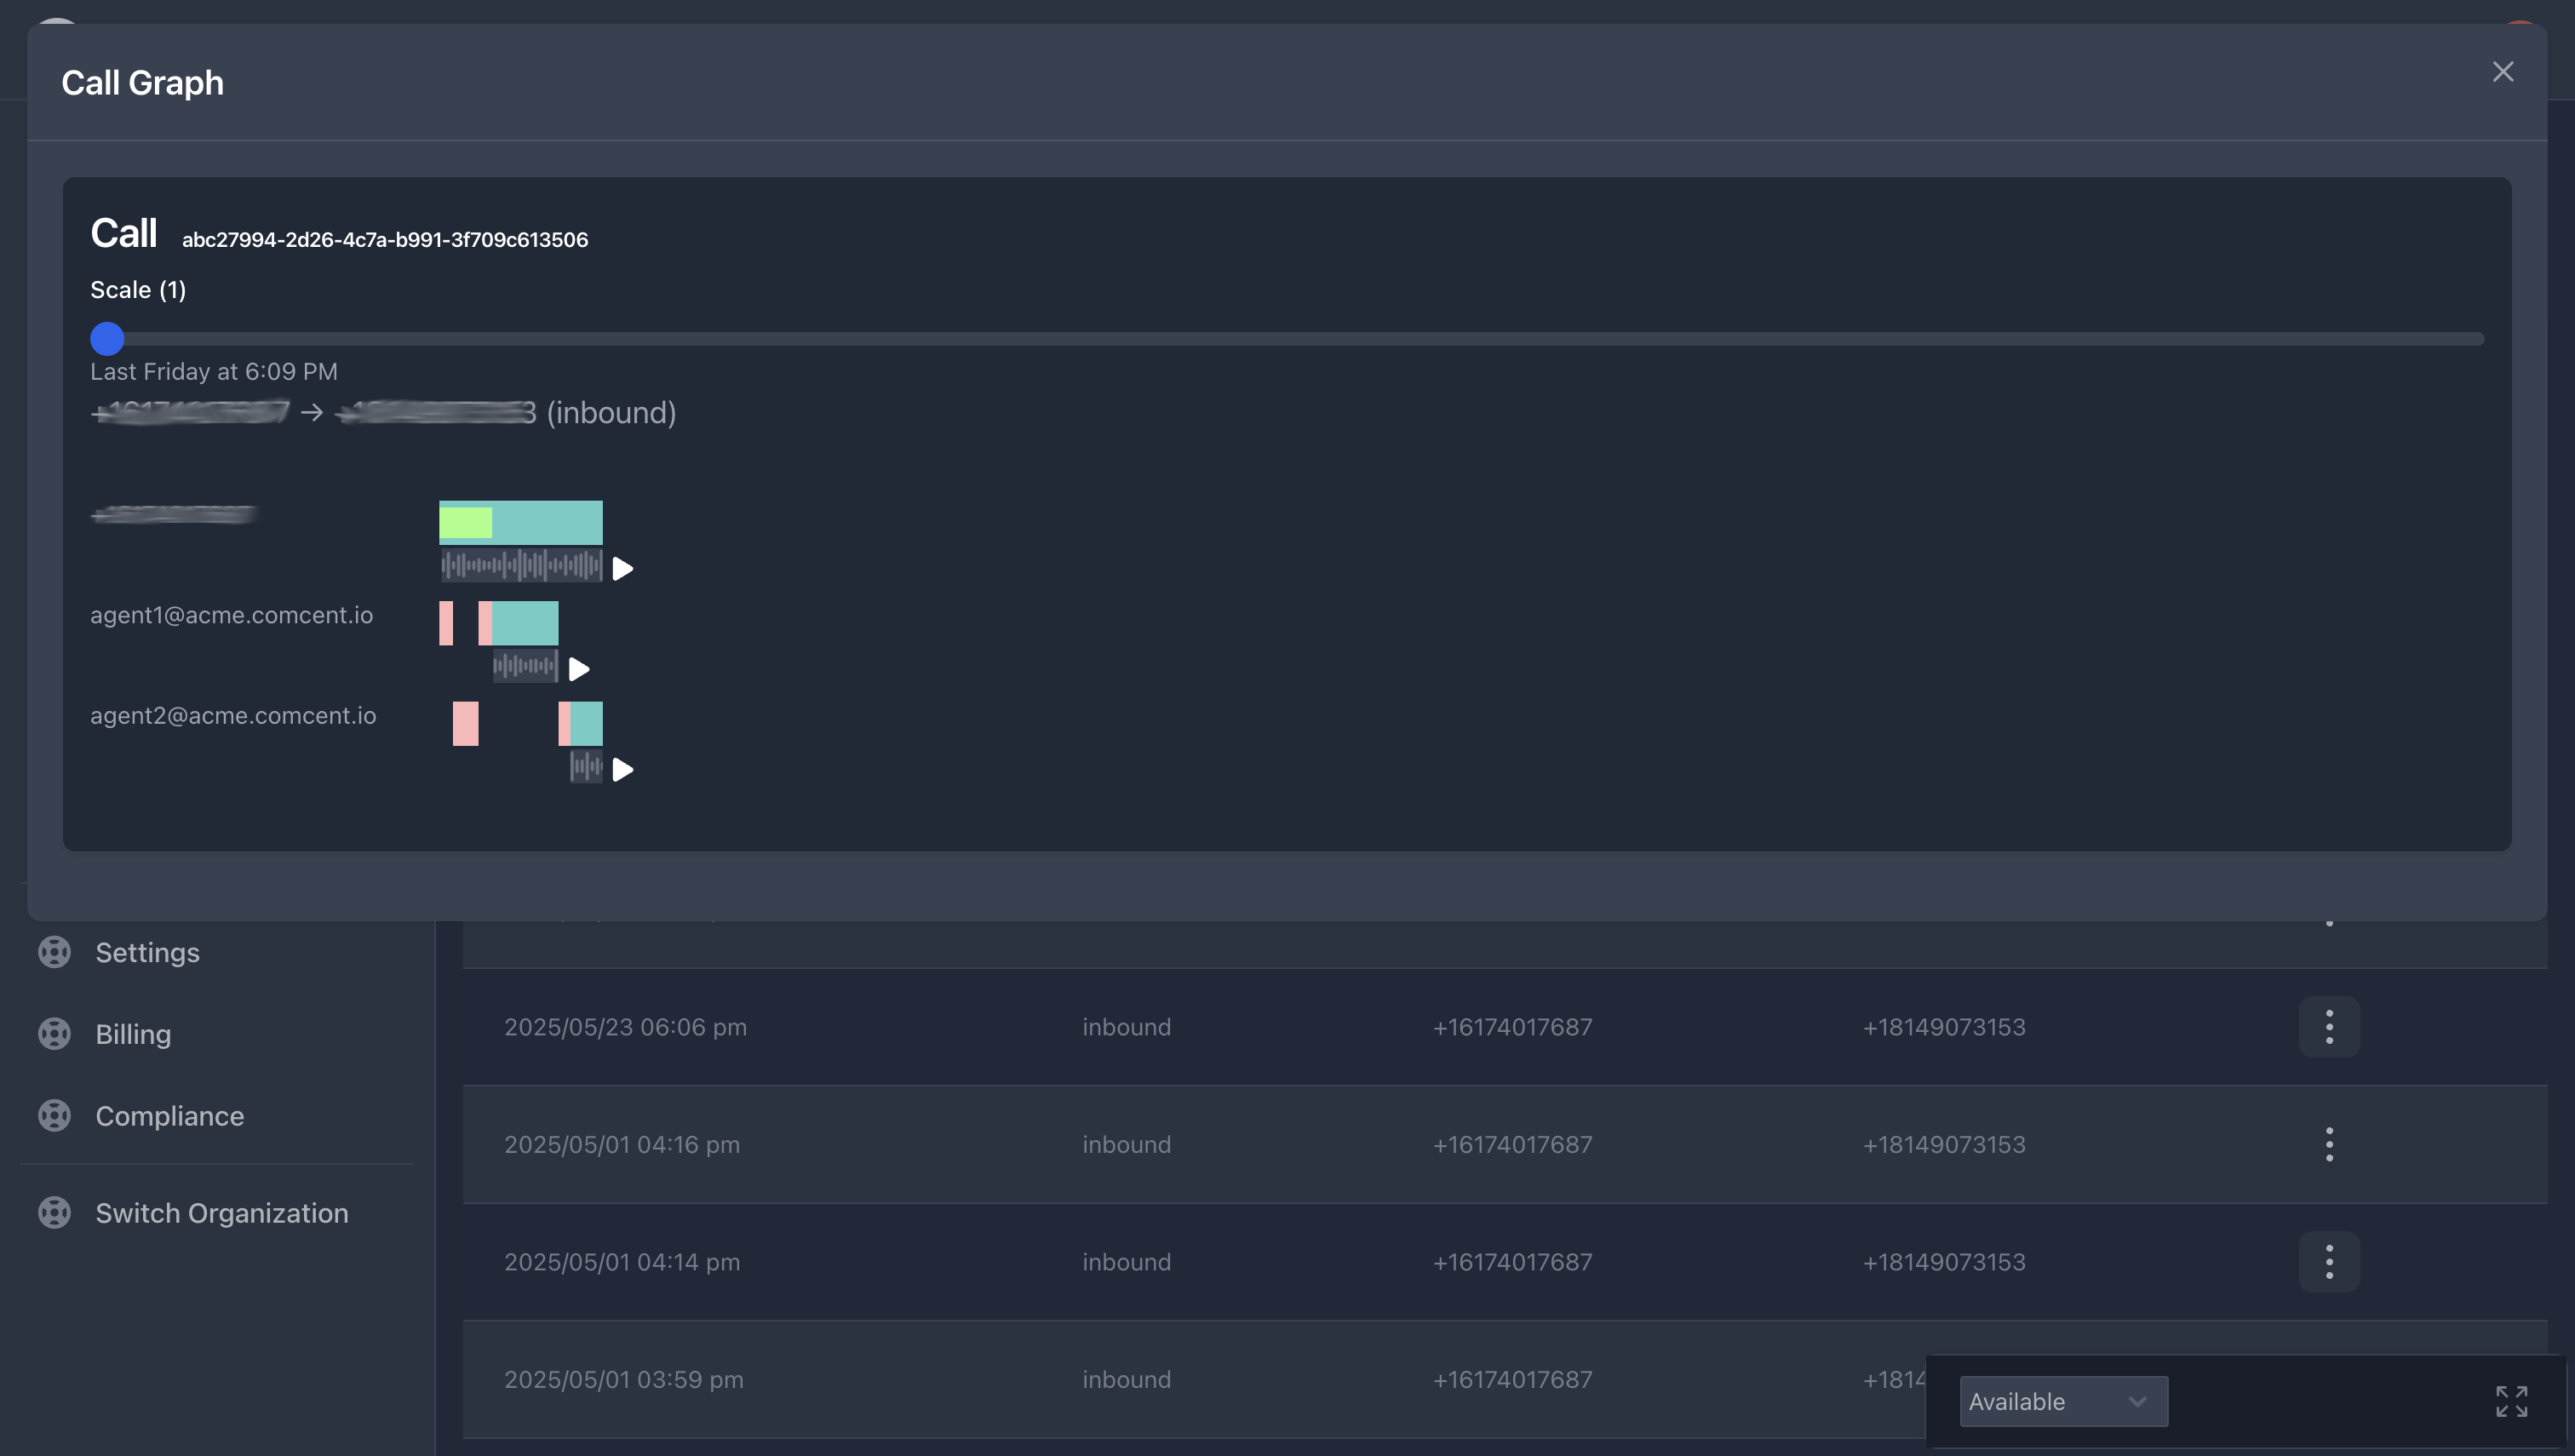
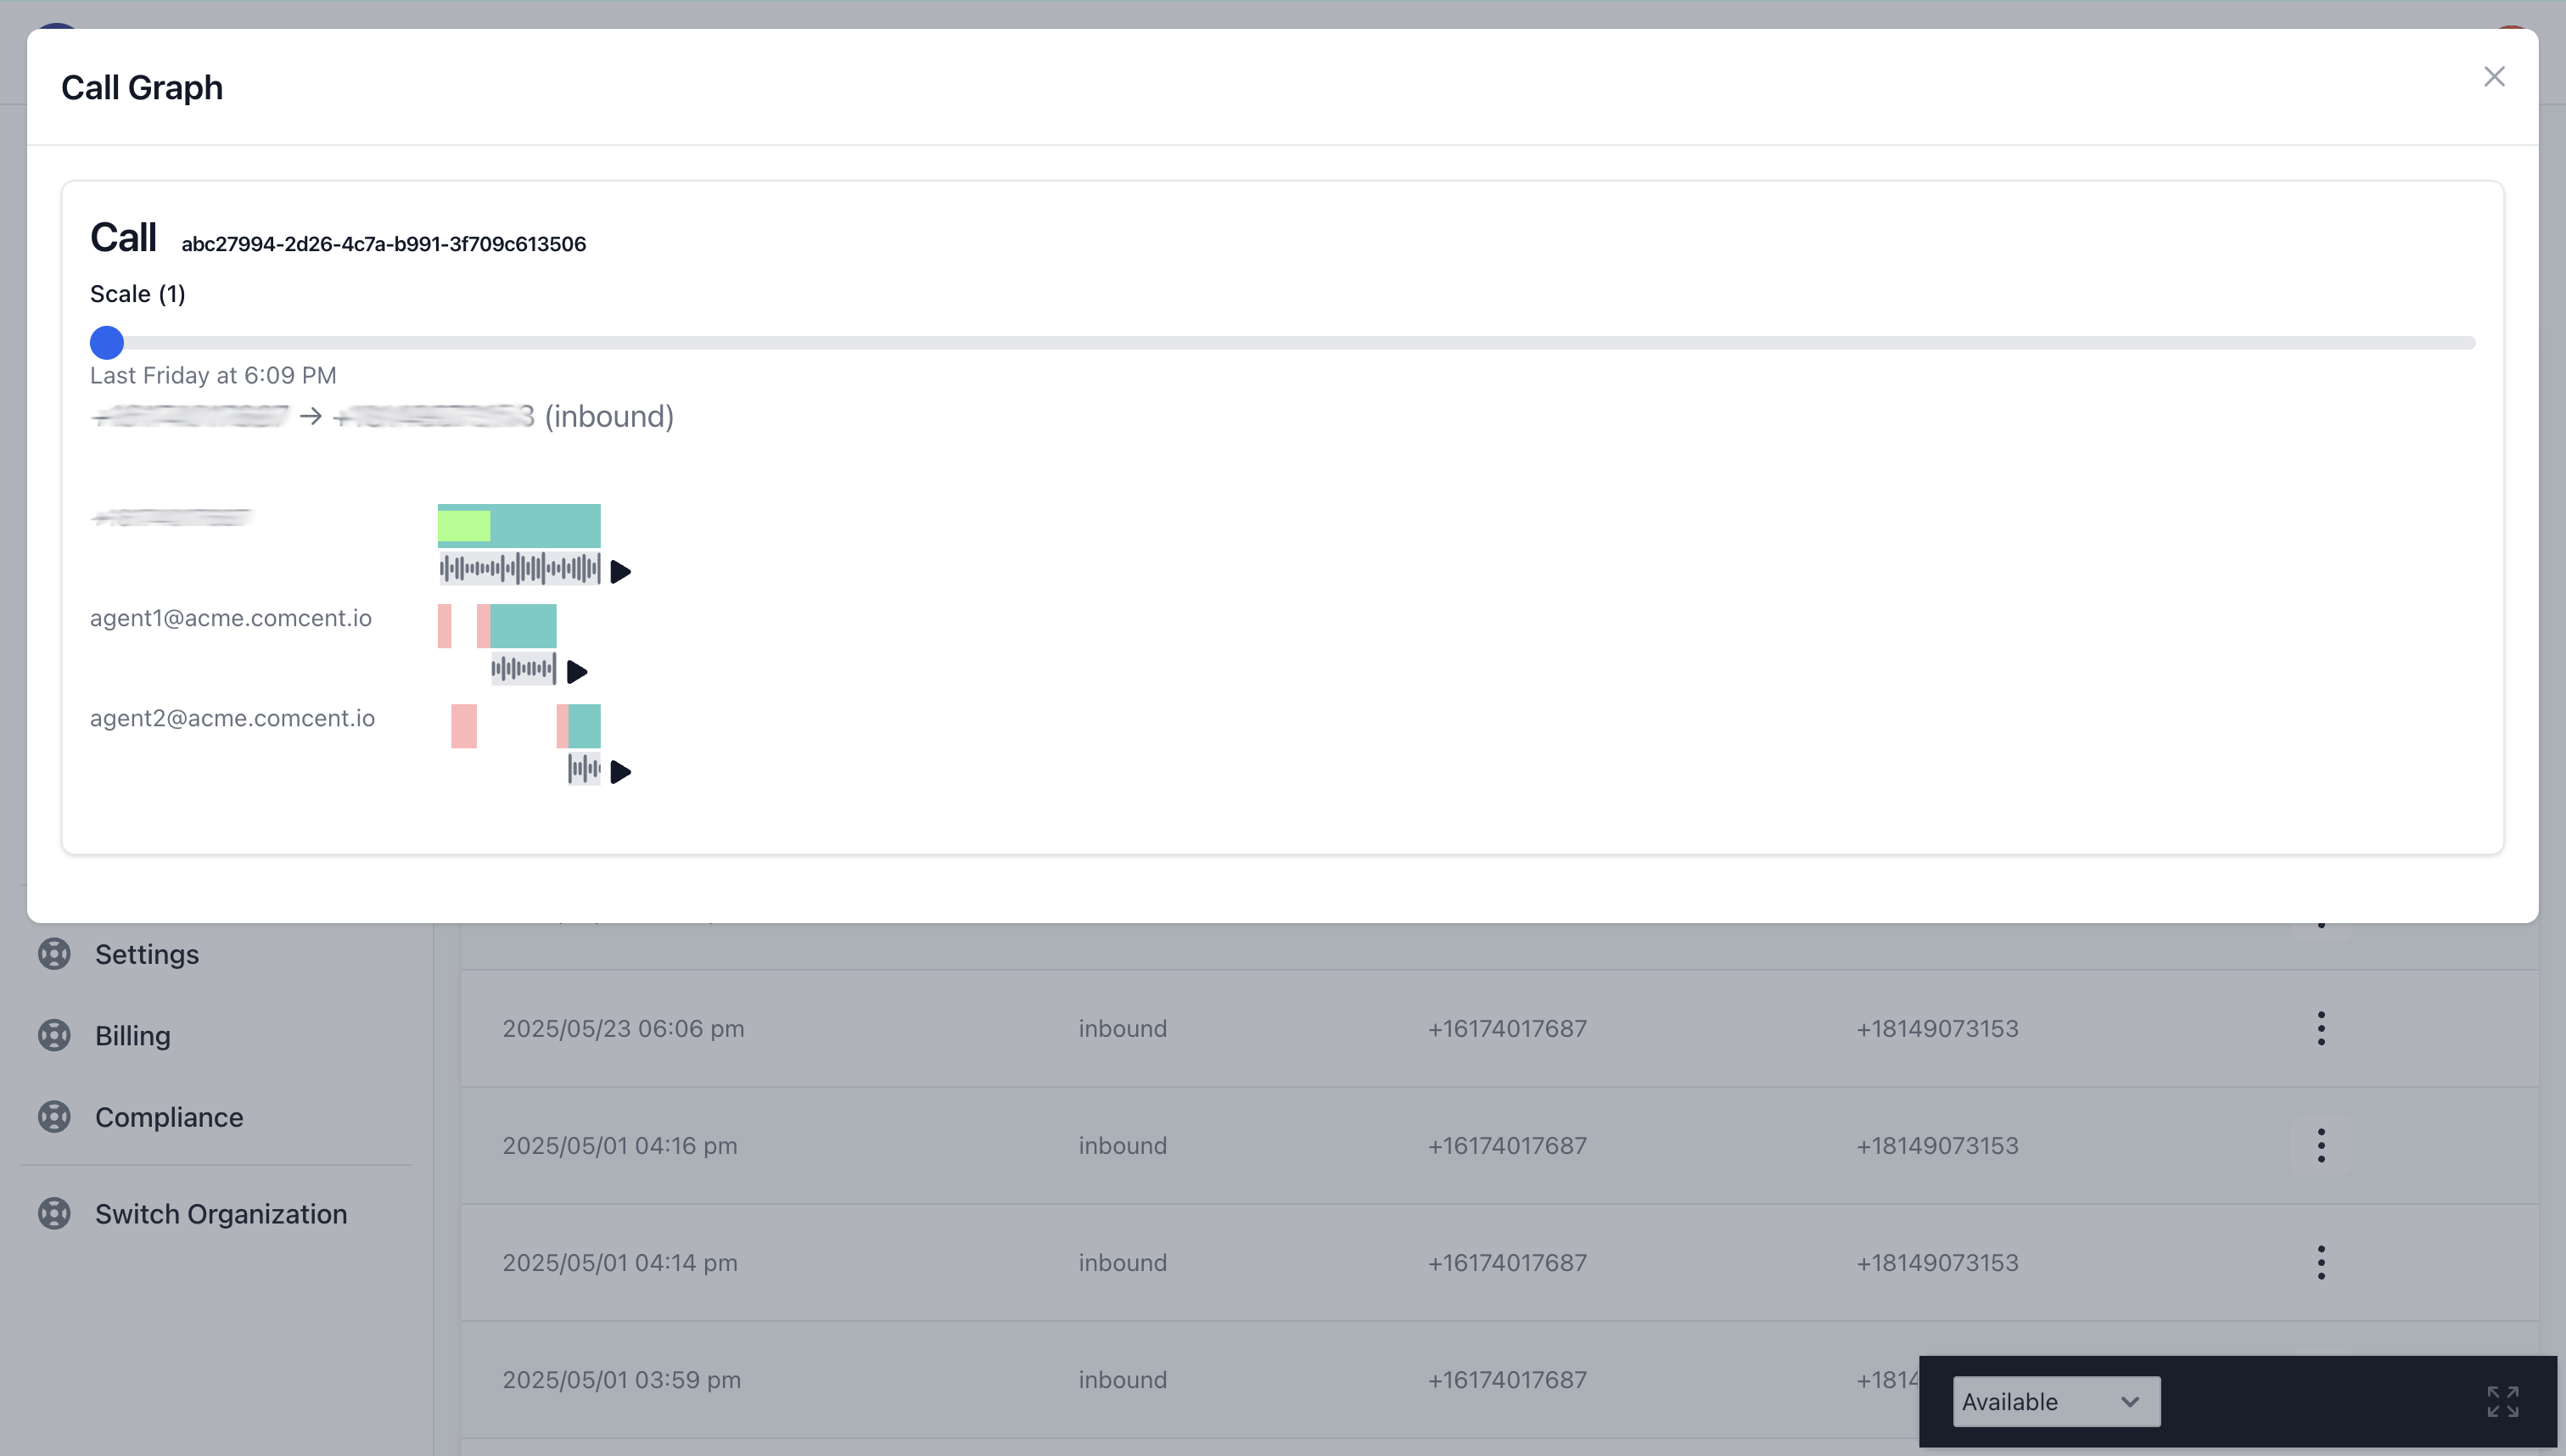
The interface allows you to adjust the view using a scale slider. The horizontal axis represents the call’s timeline. For instance, the initial point indicates when the customer initiated the call.
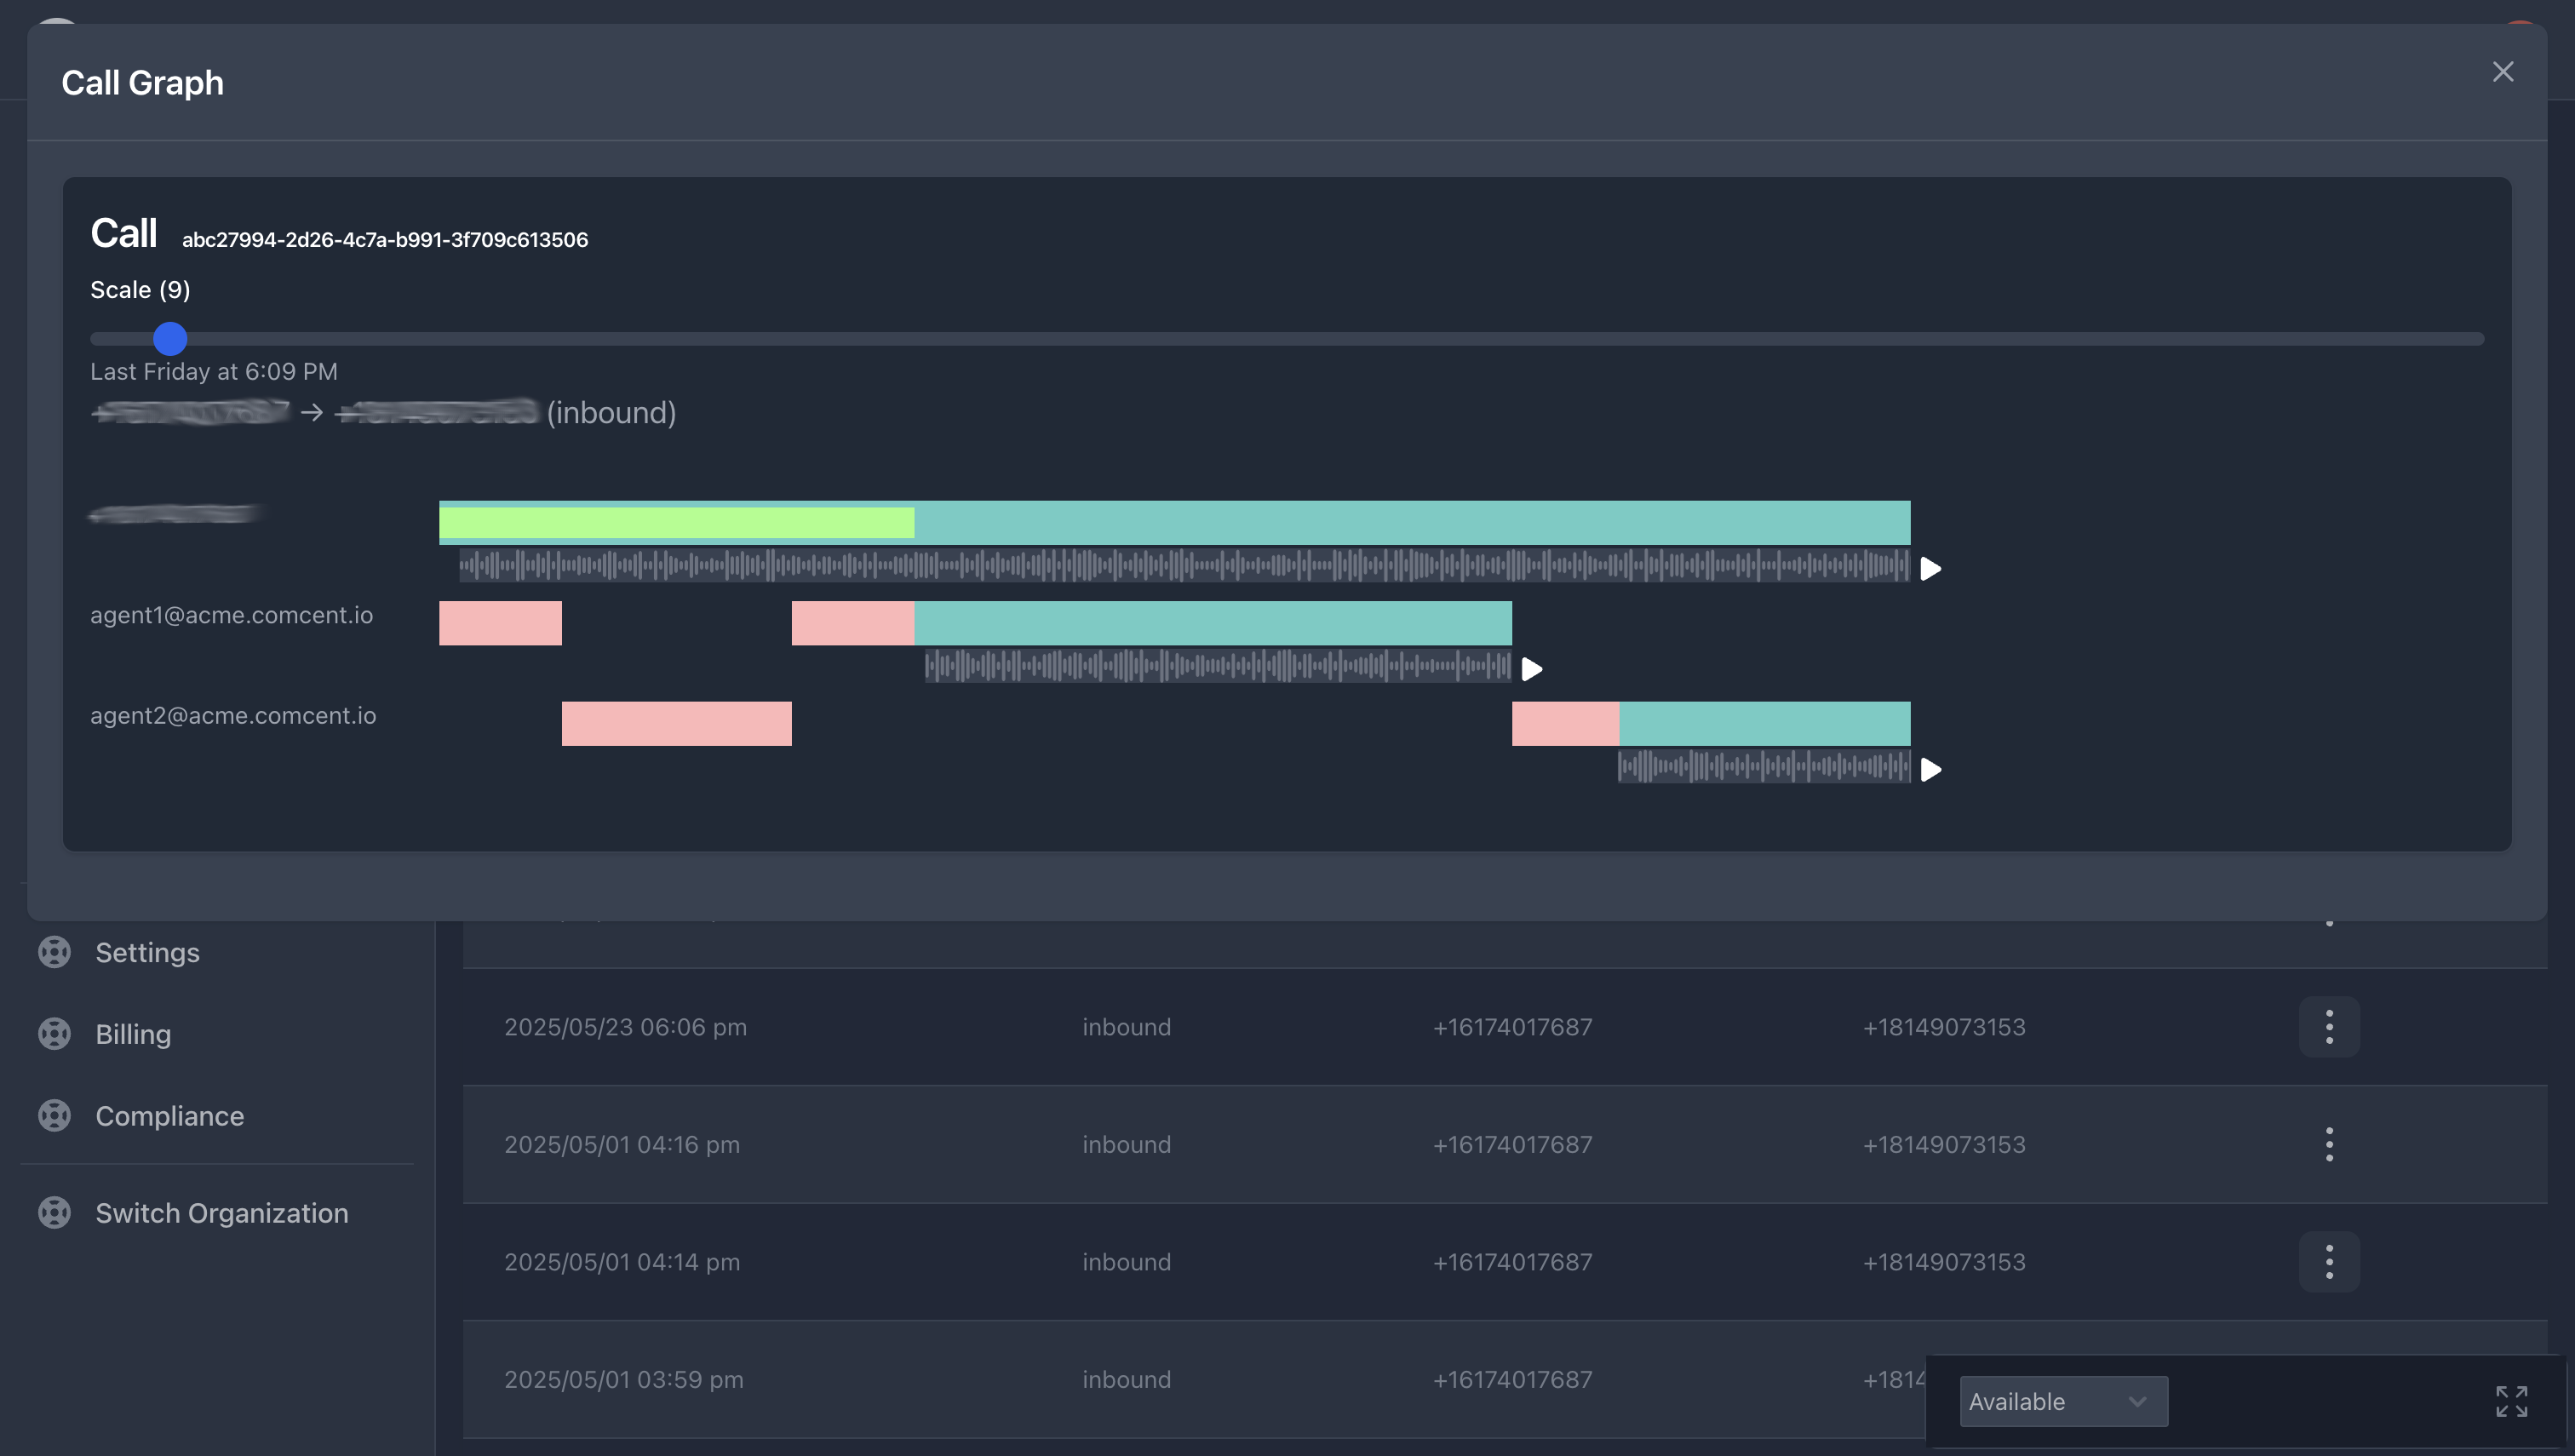
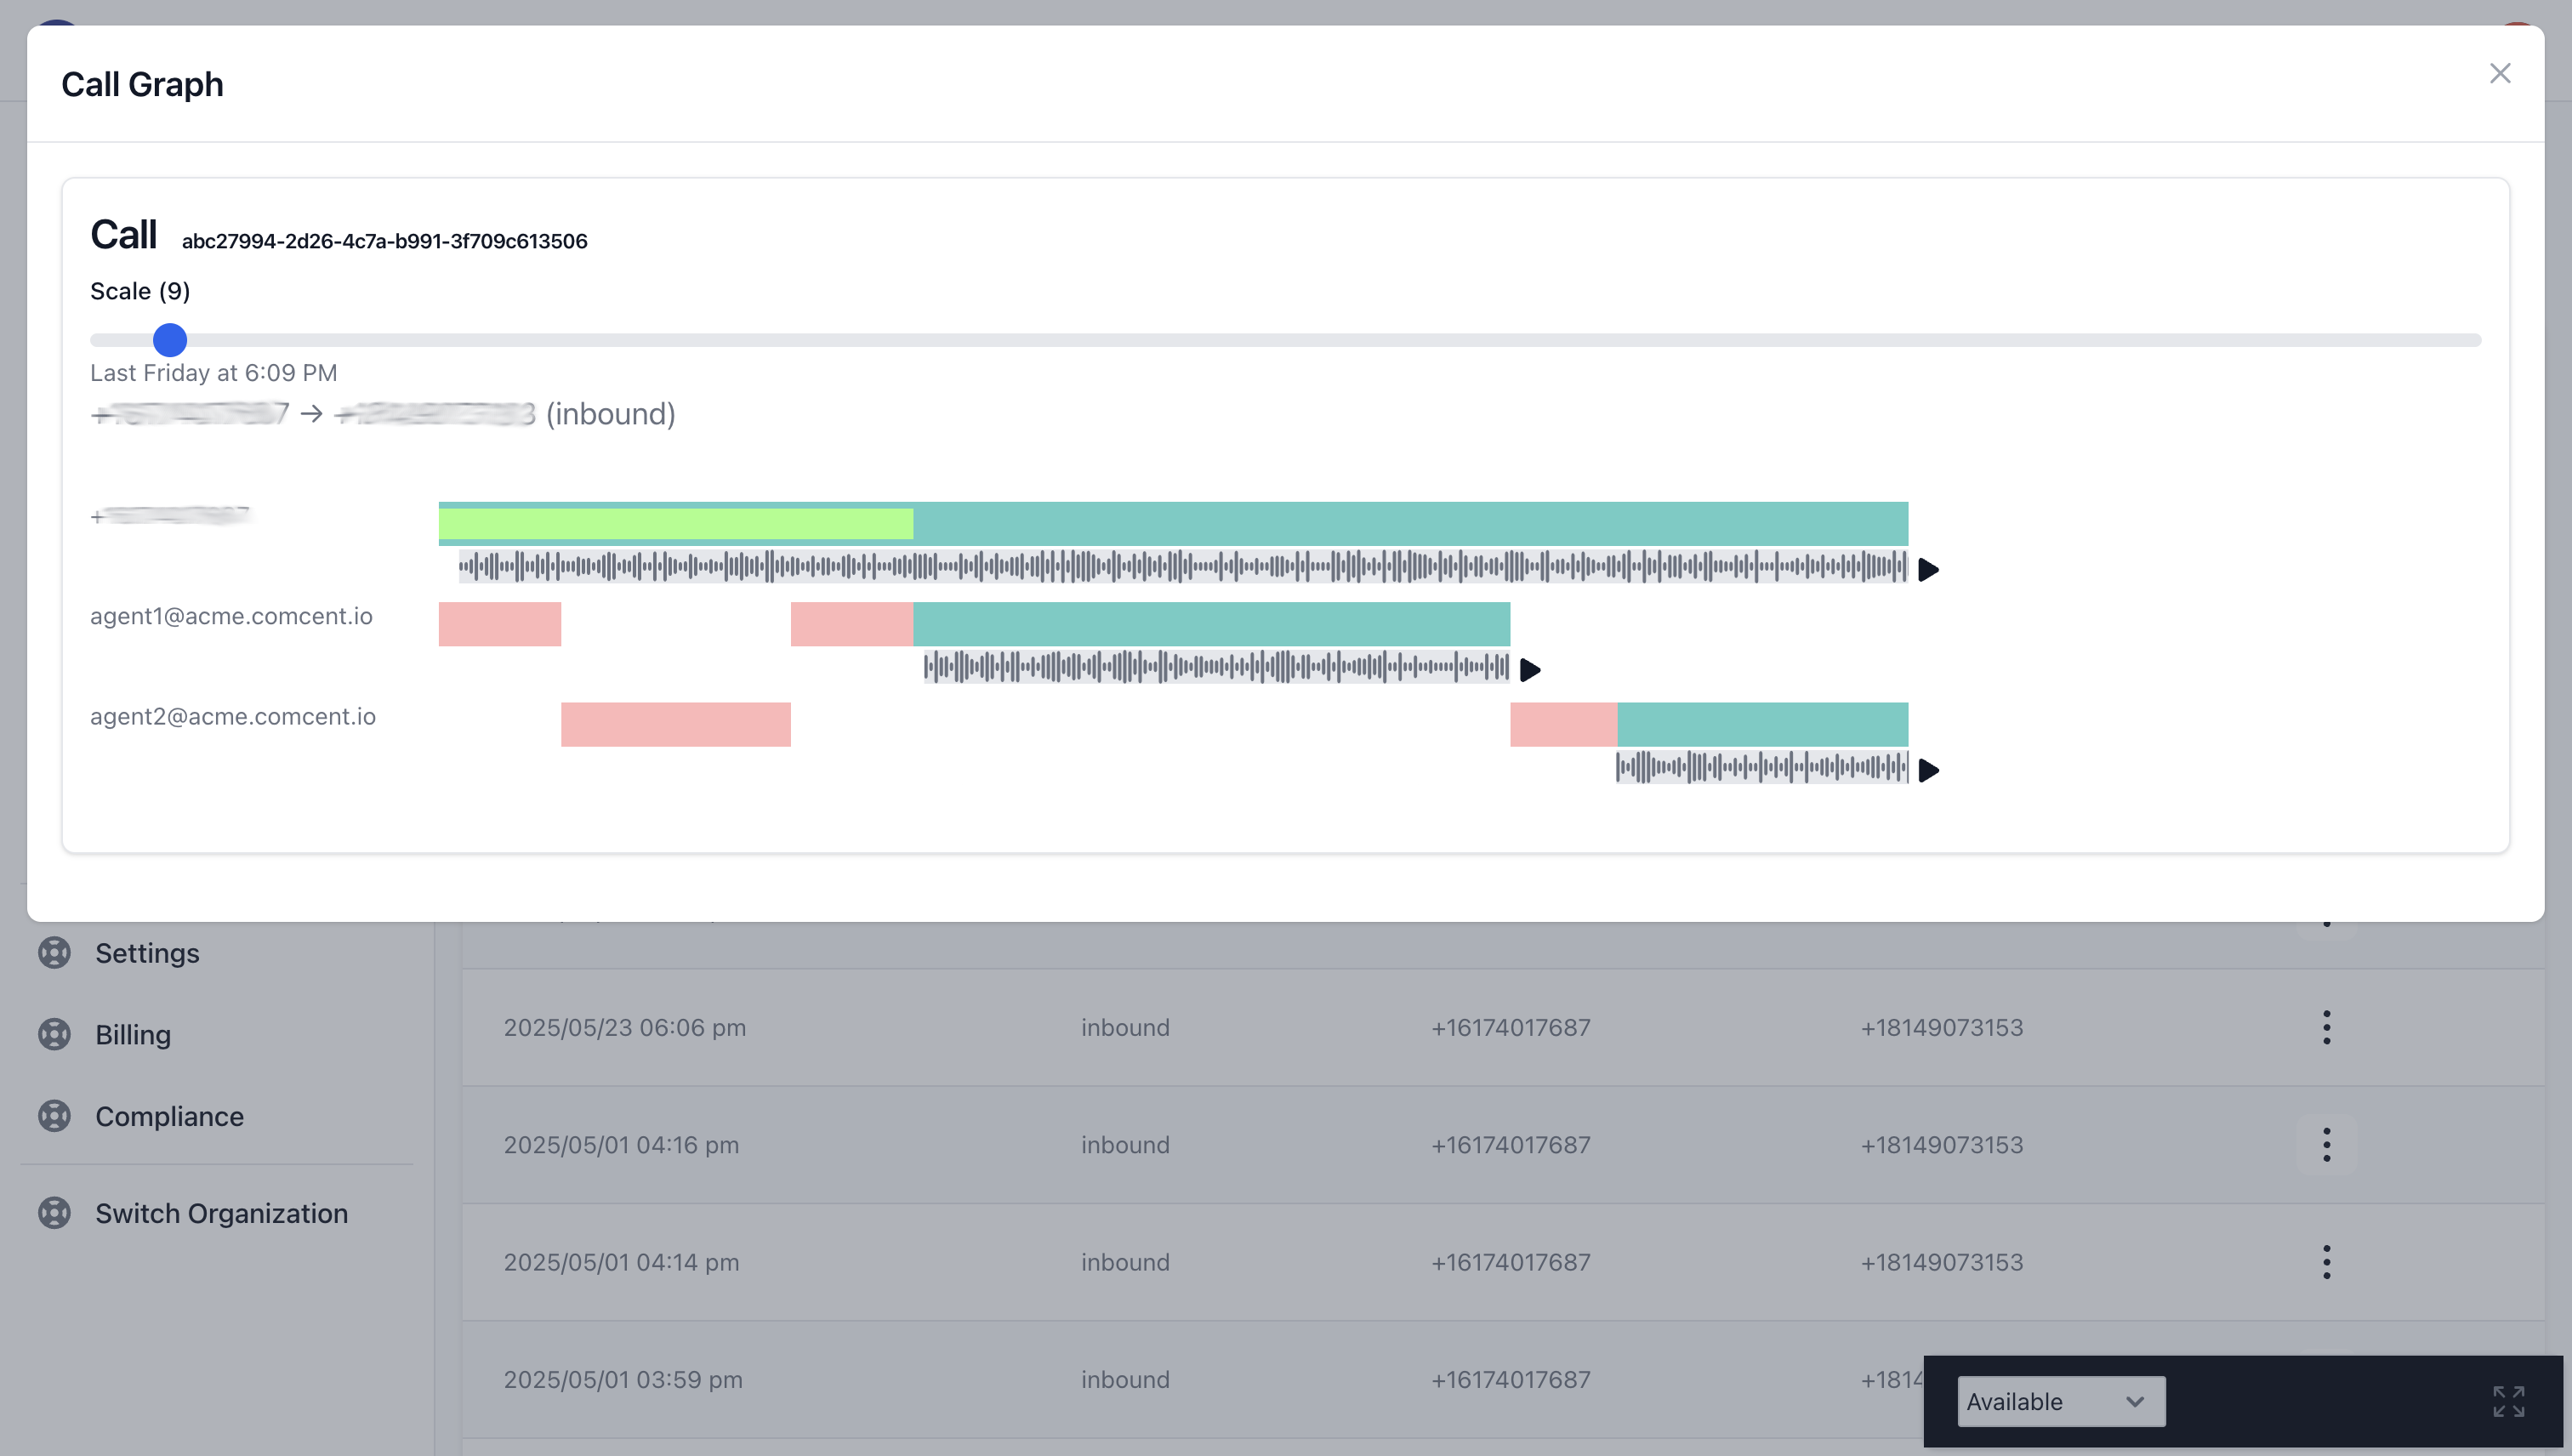
The green bar indicates a 31-second queue wait time.
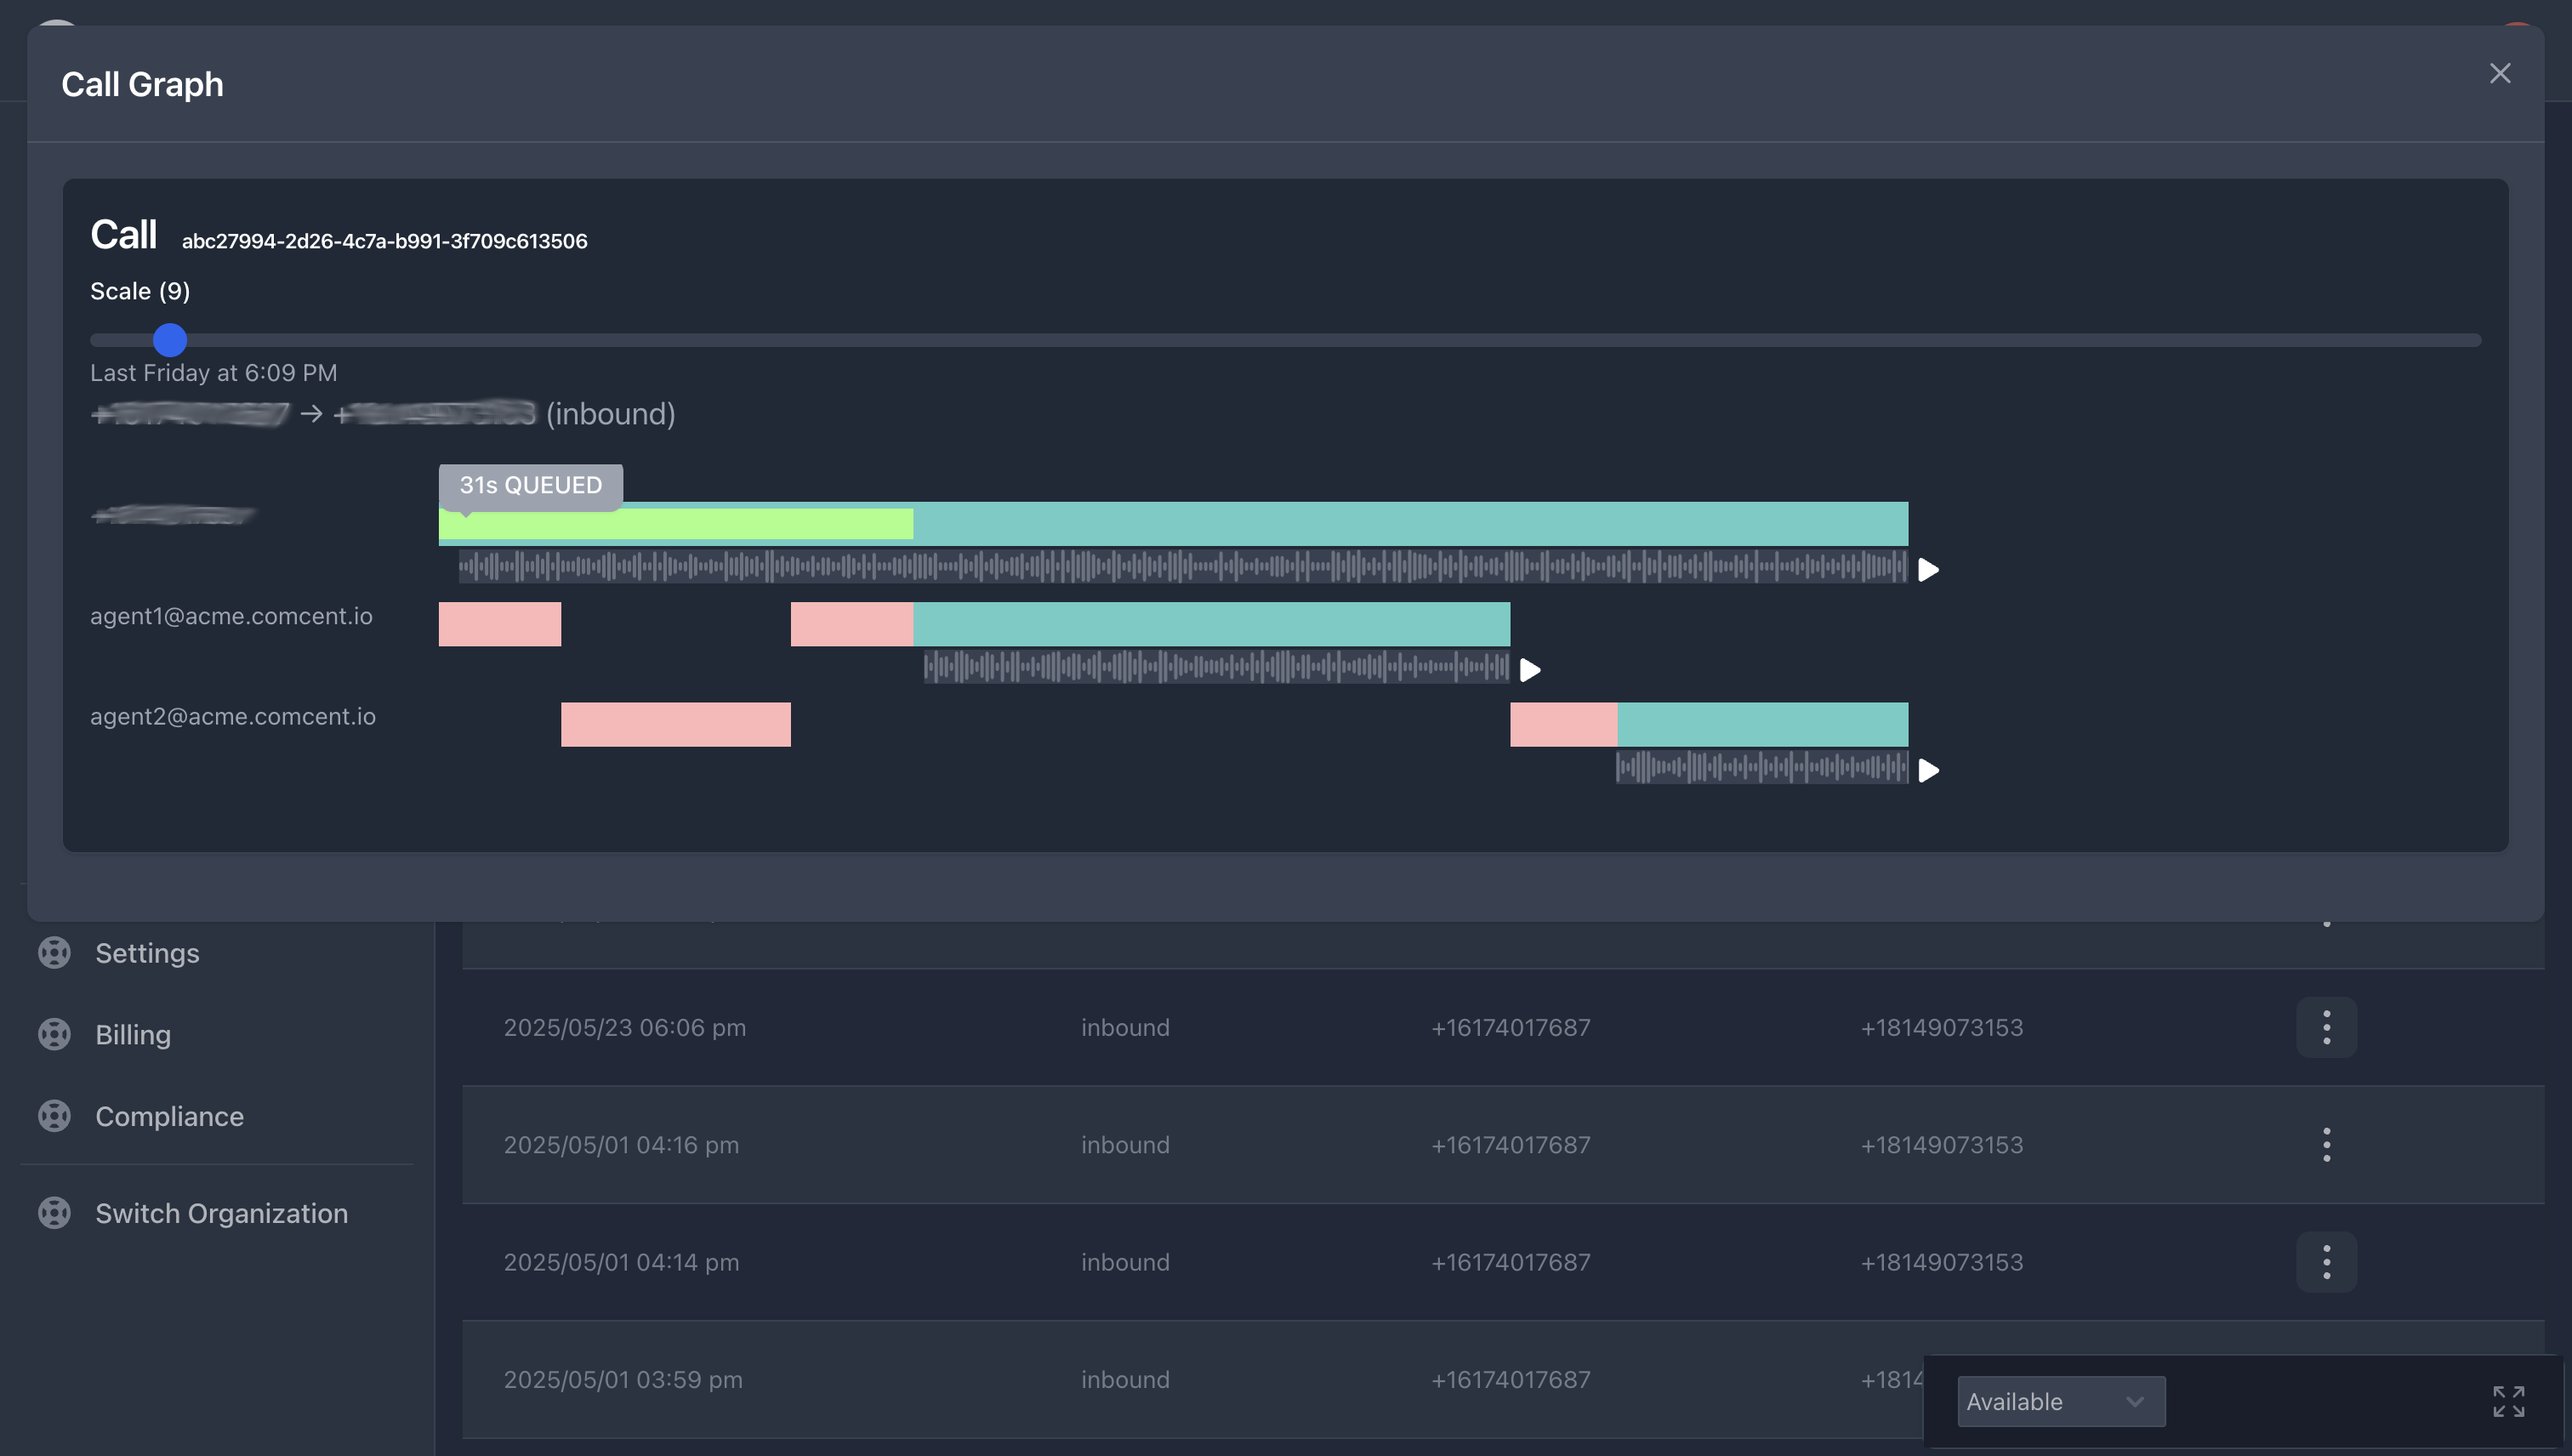
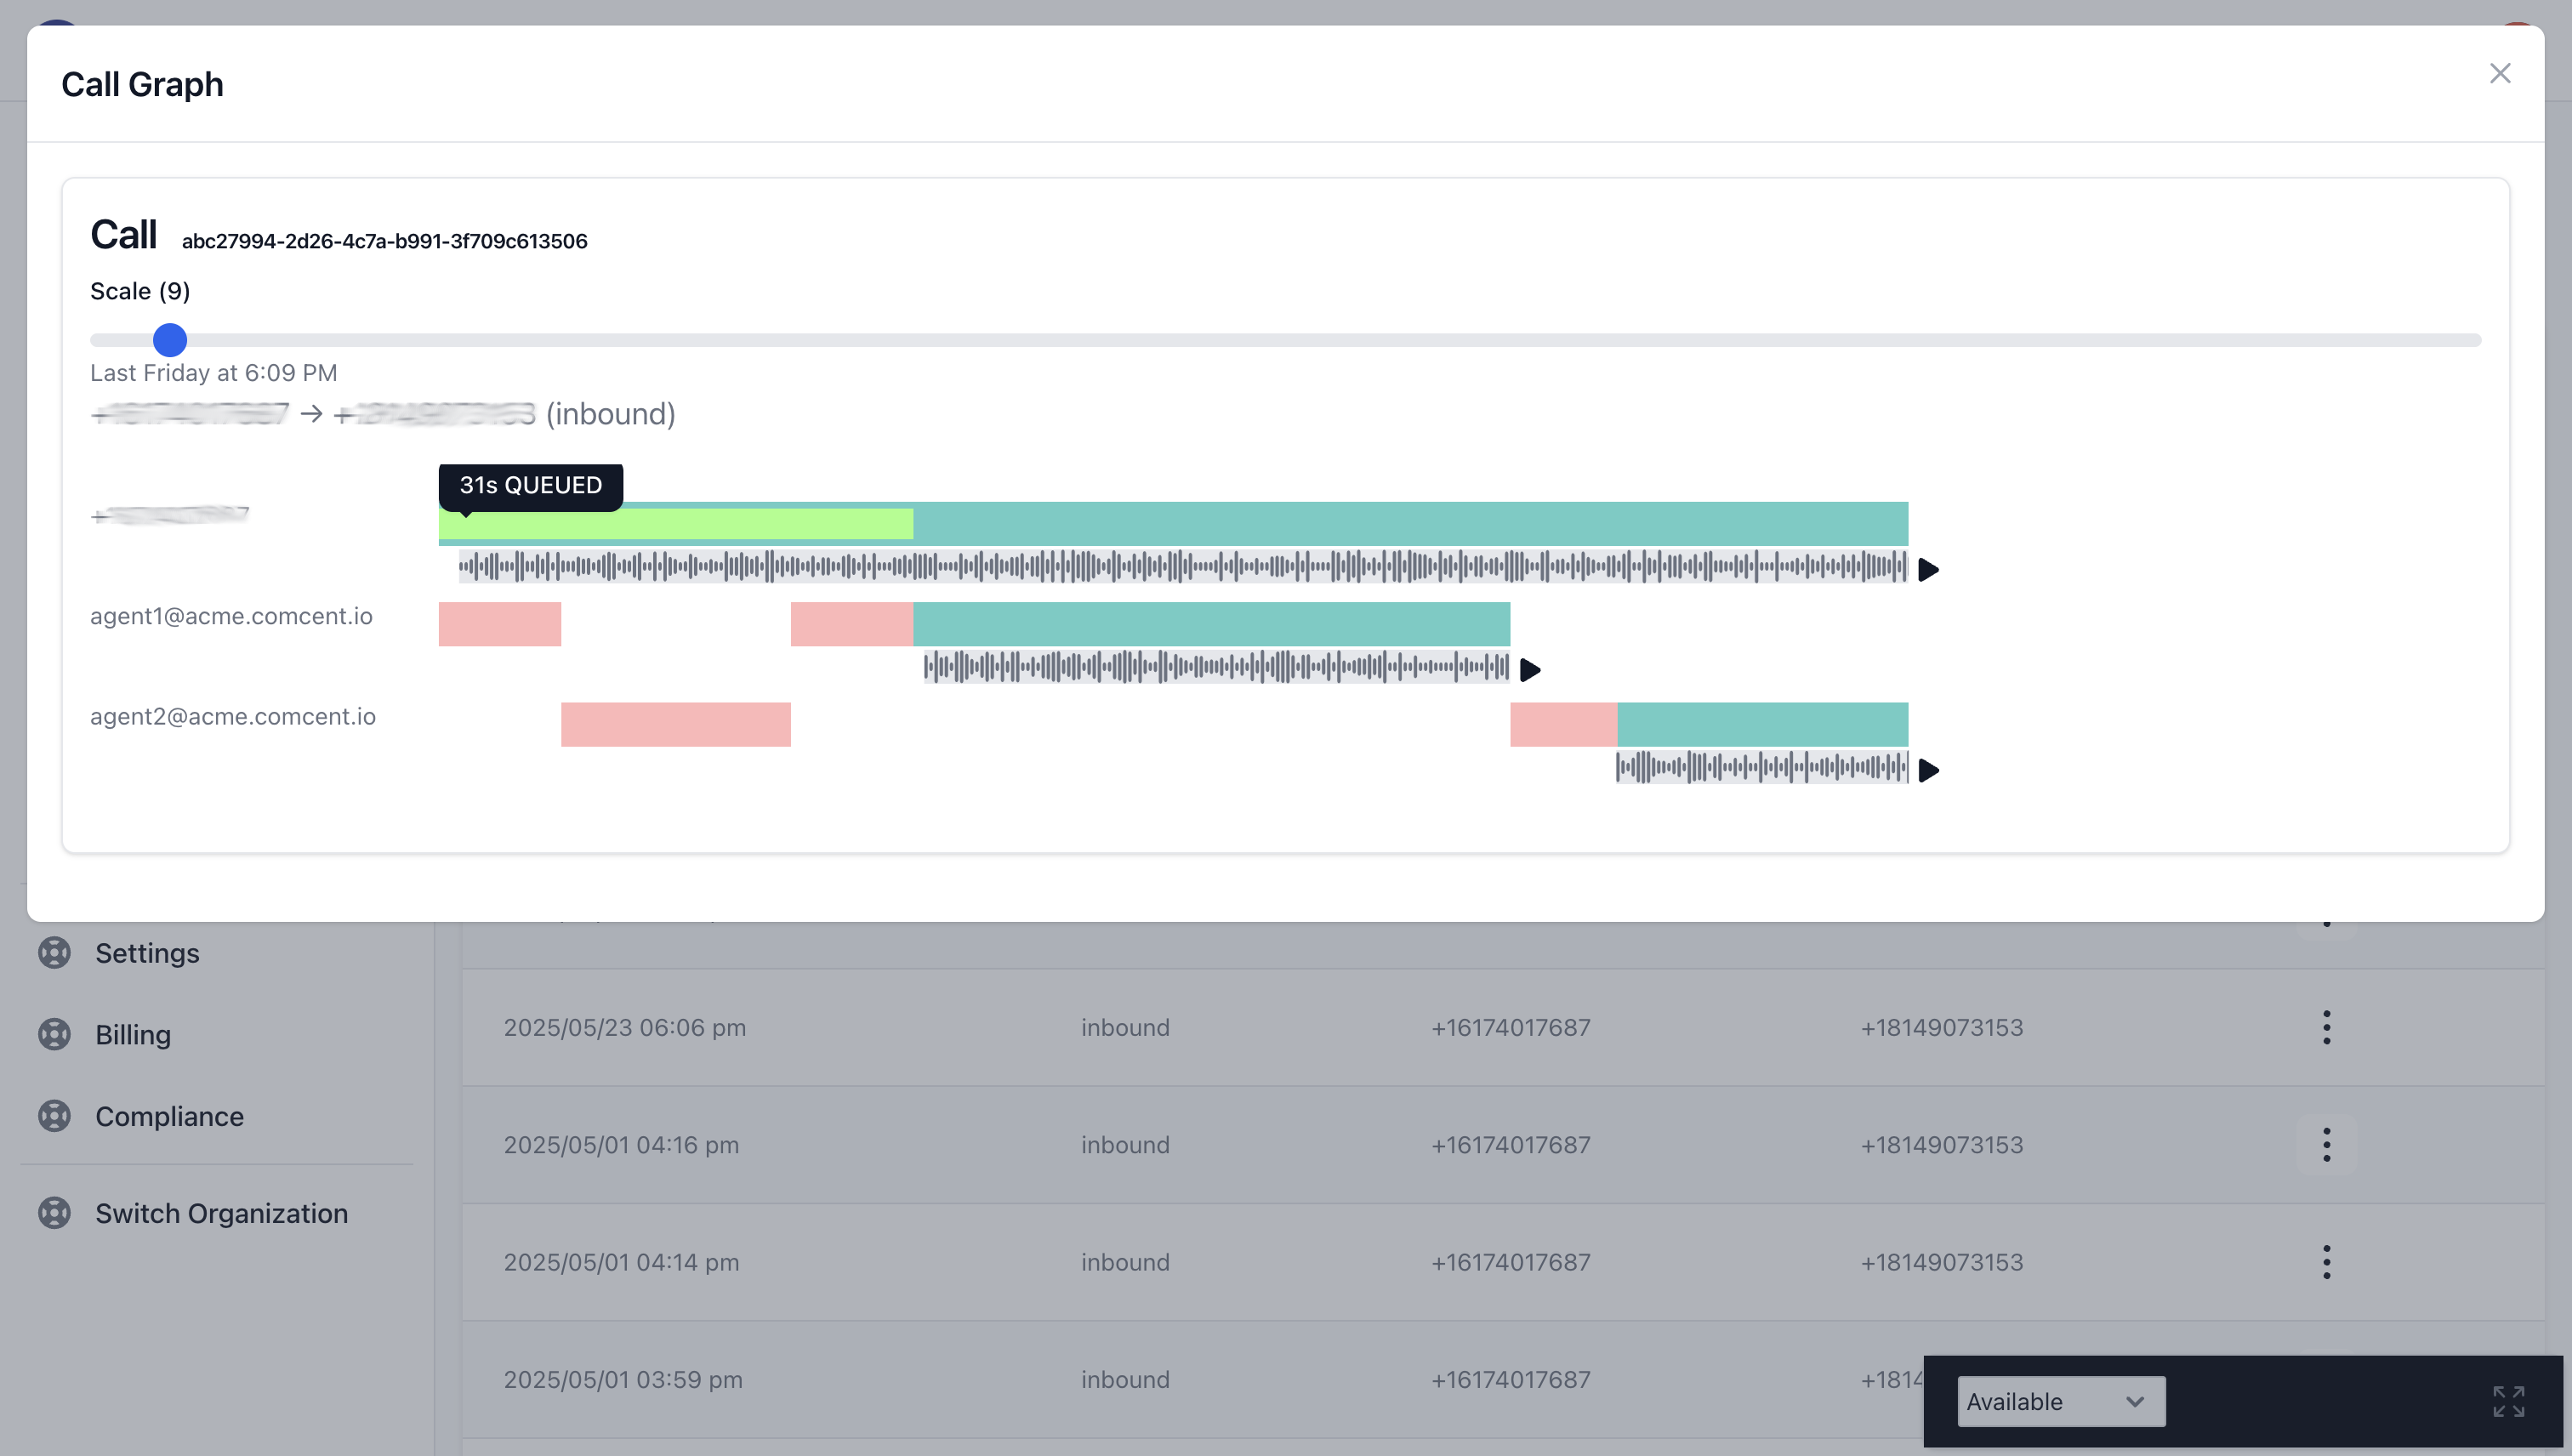
During this period, the system attempted to connect with Agent 1 for 8 seconds without success. Subsequently, it attempted to reach Agent 2 for 10 seconds.
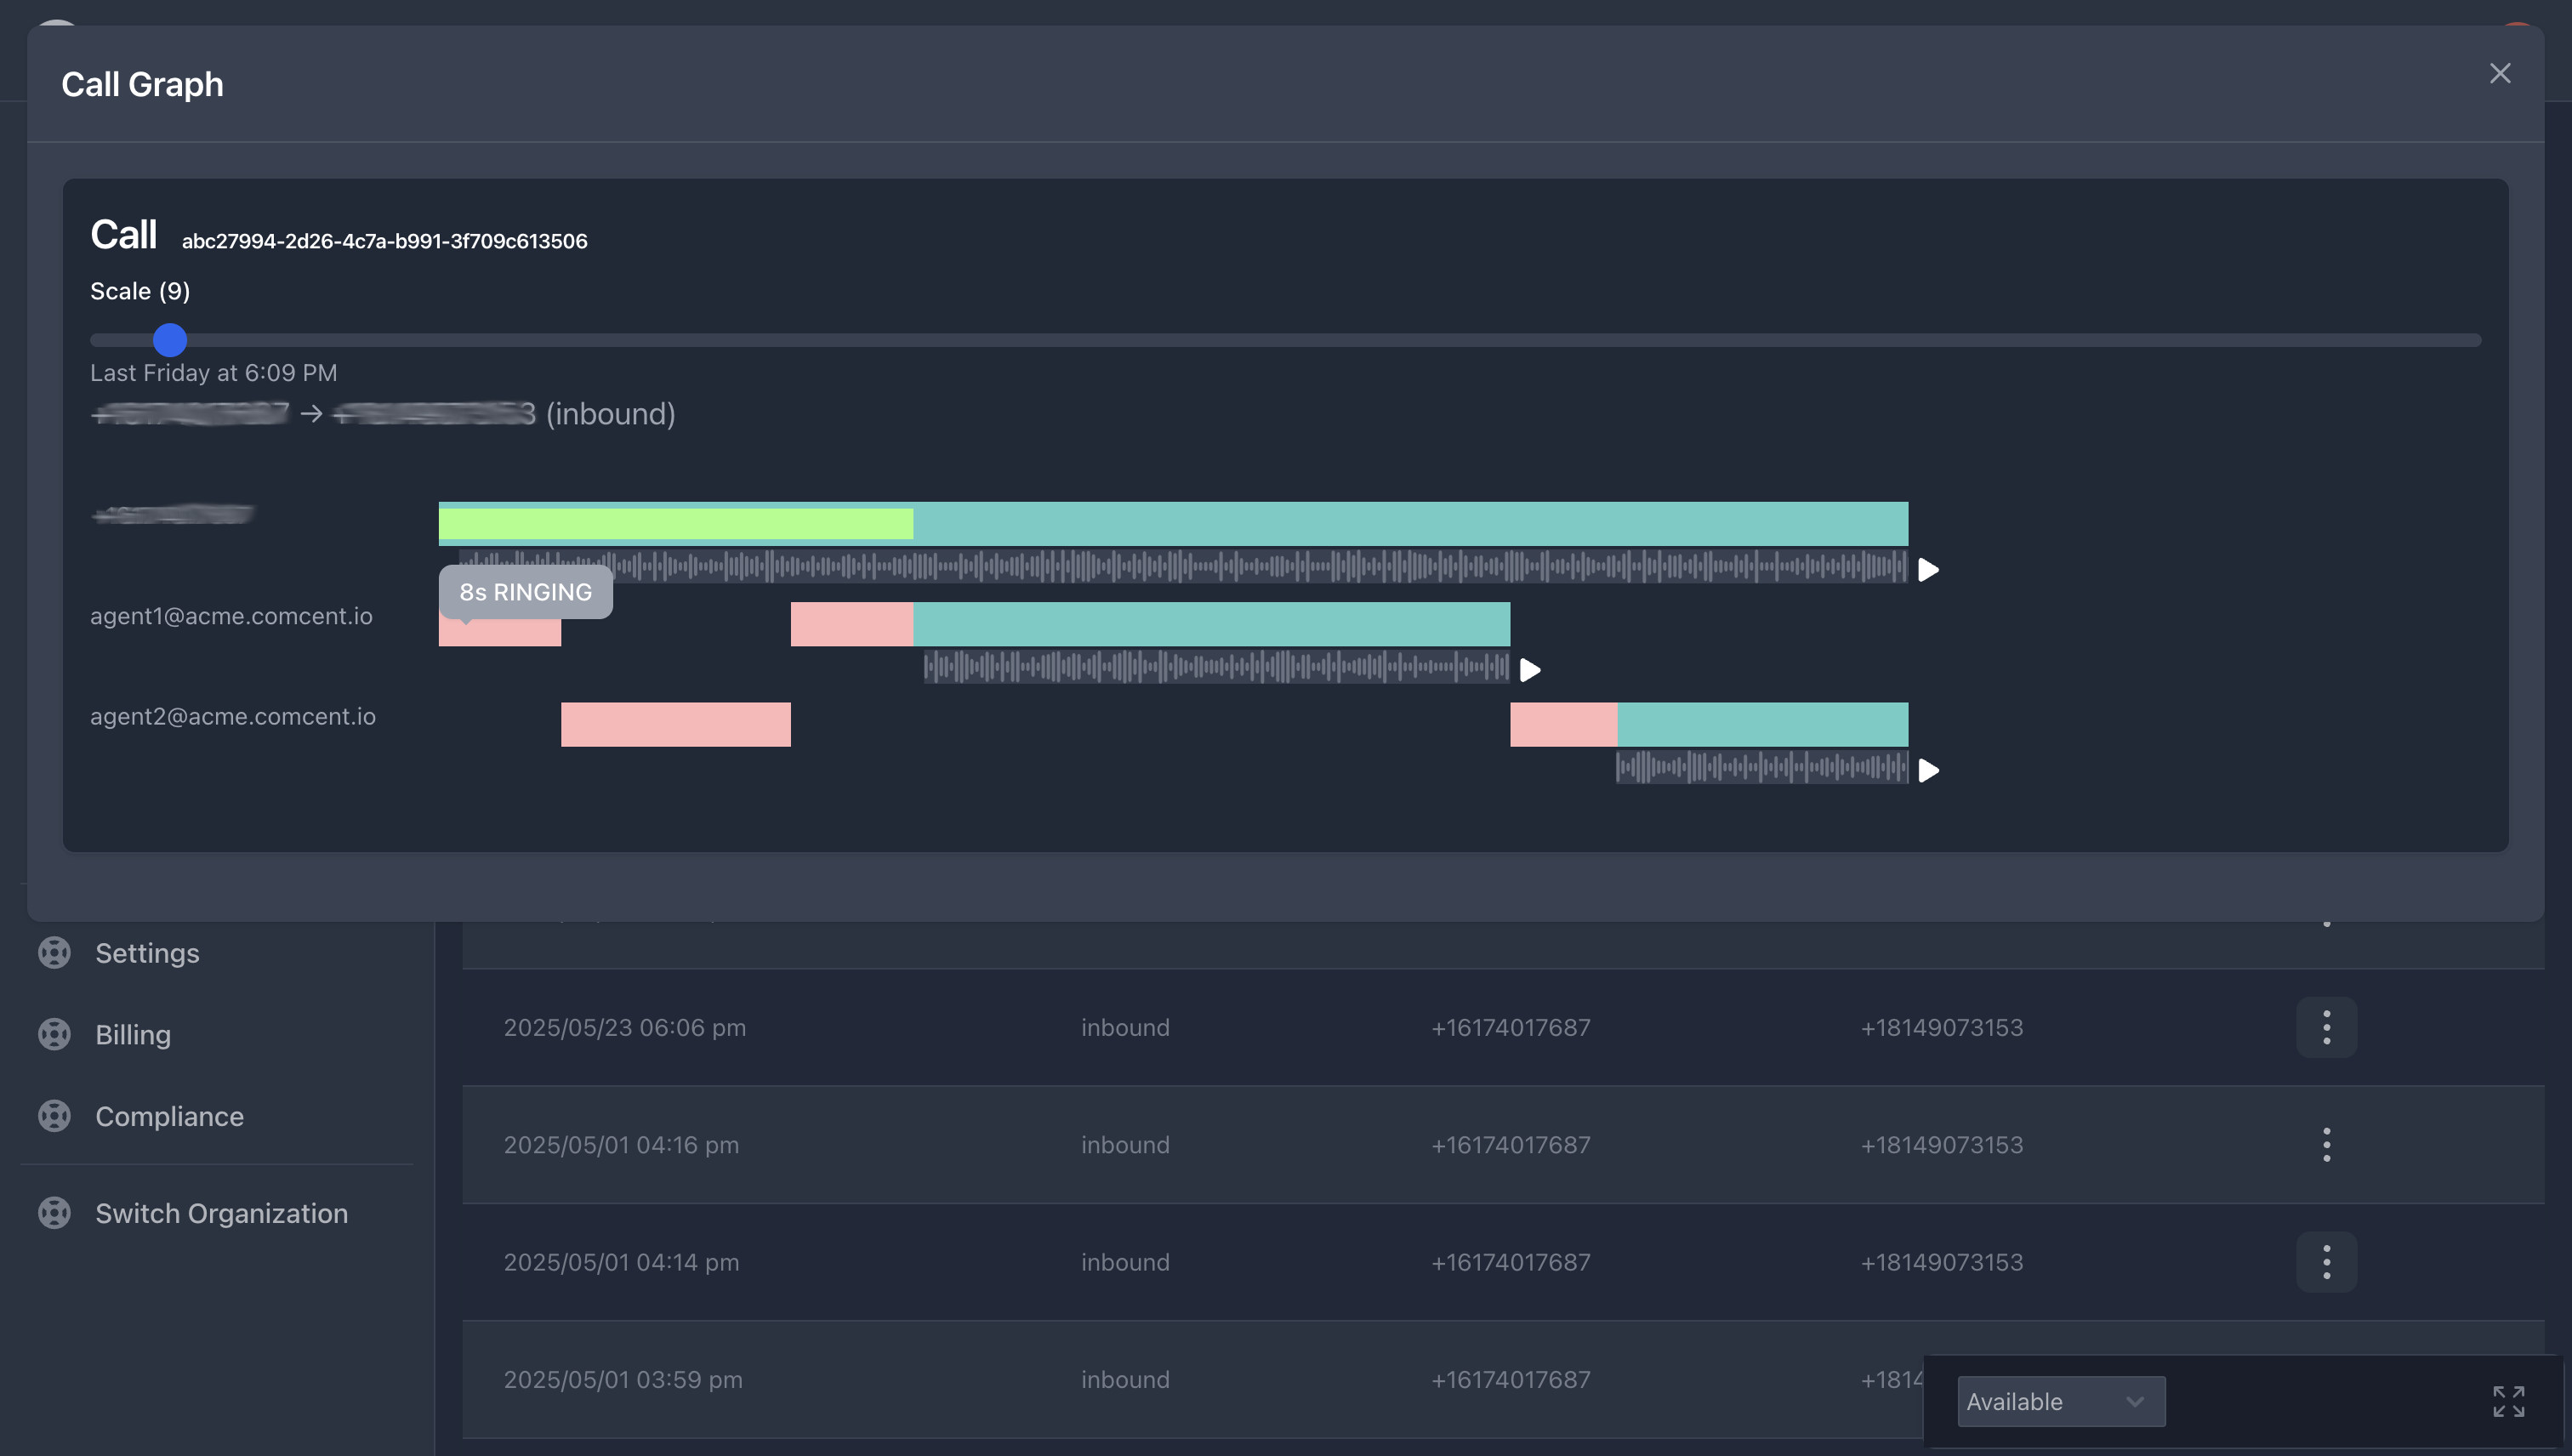
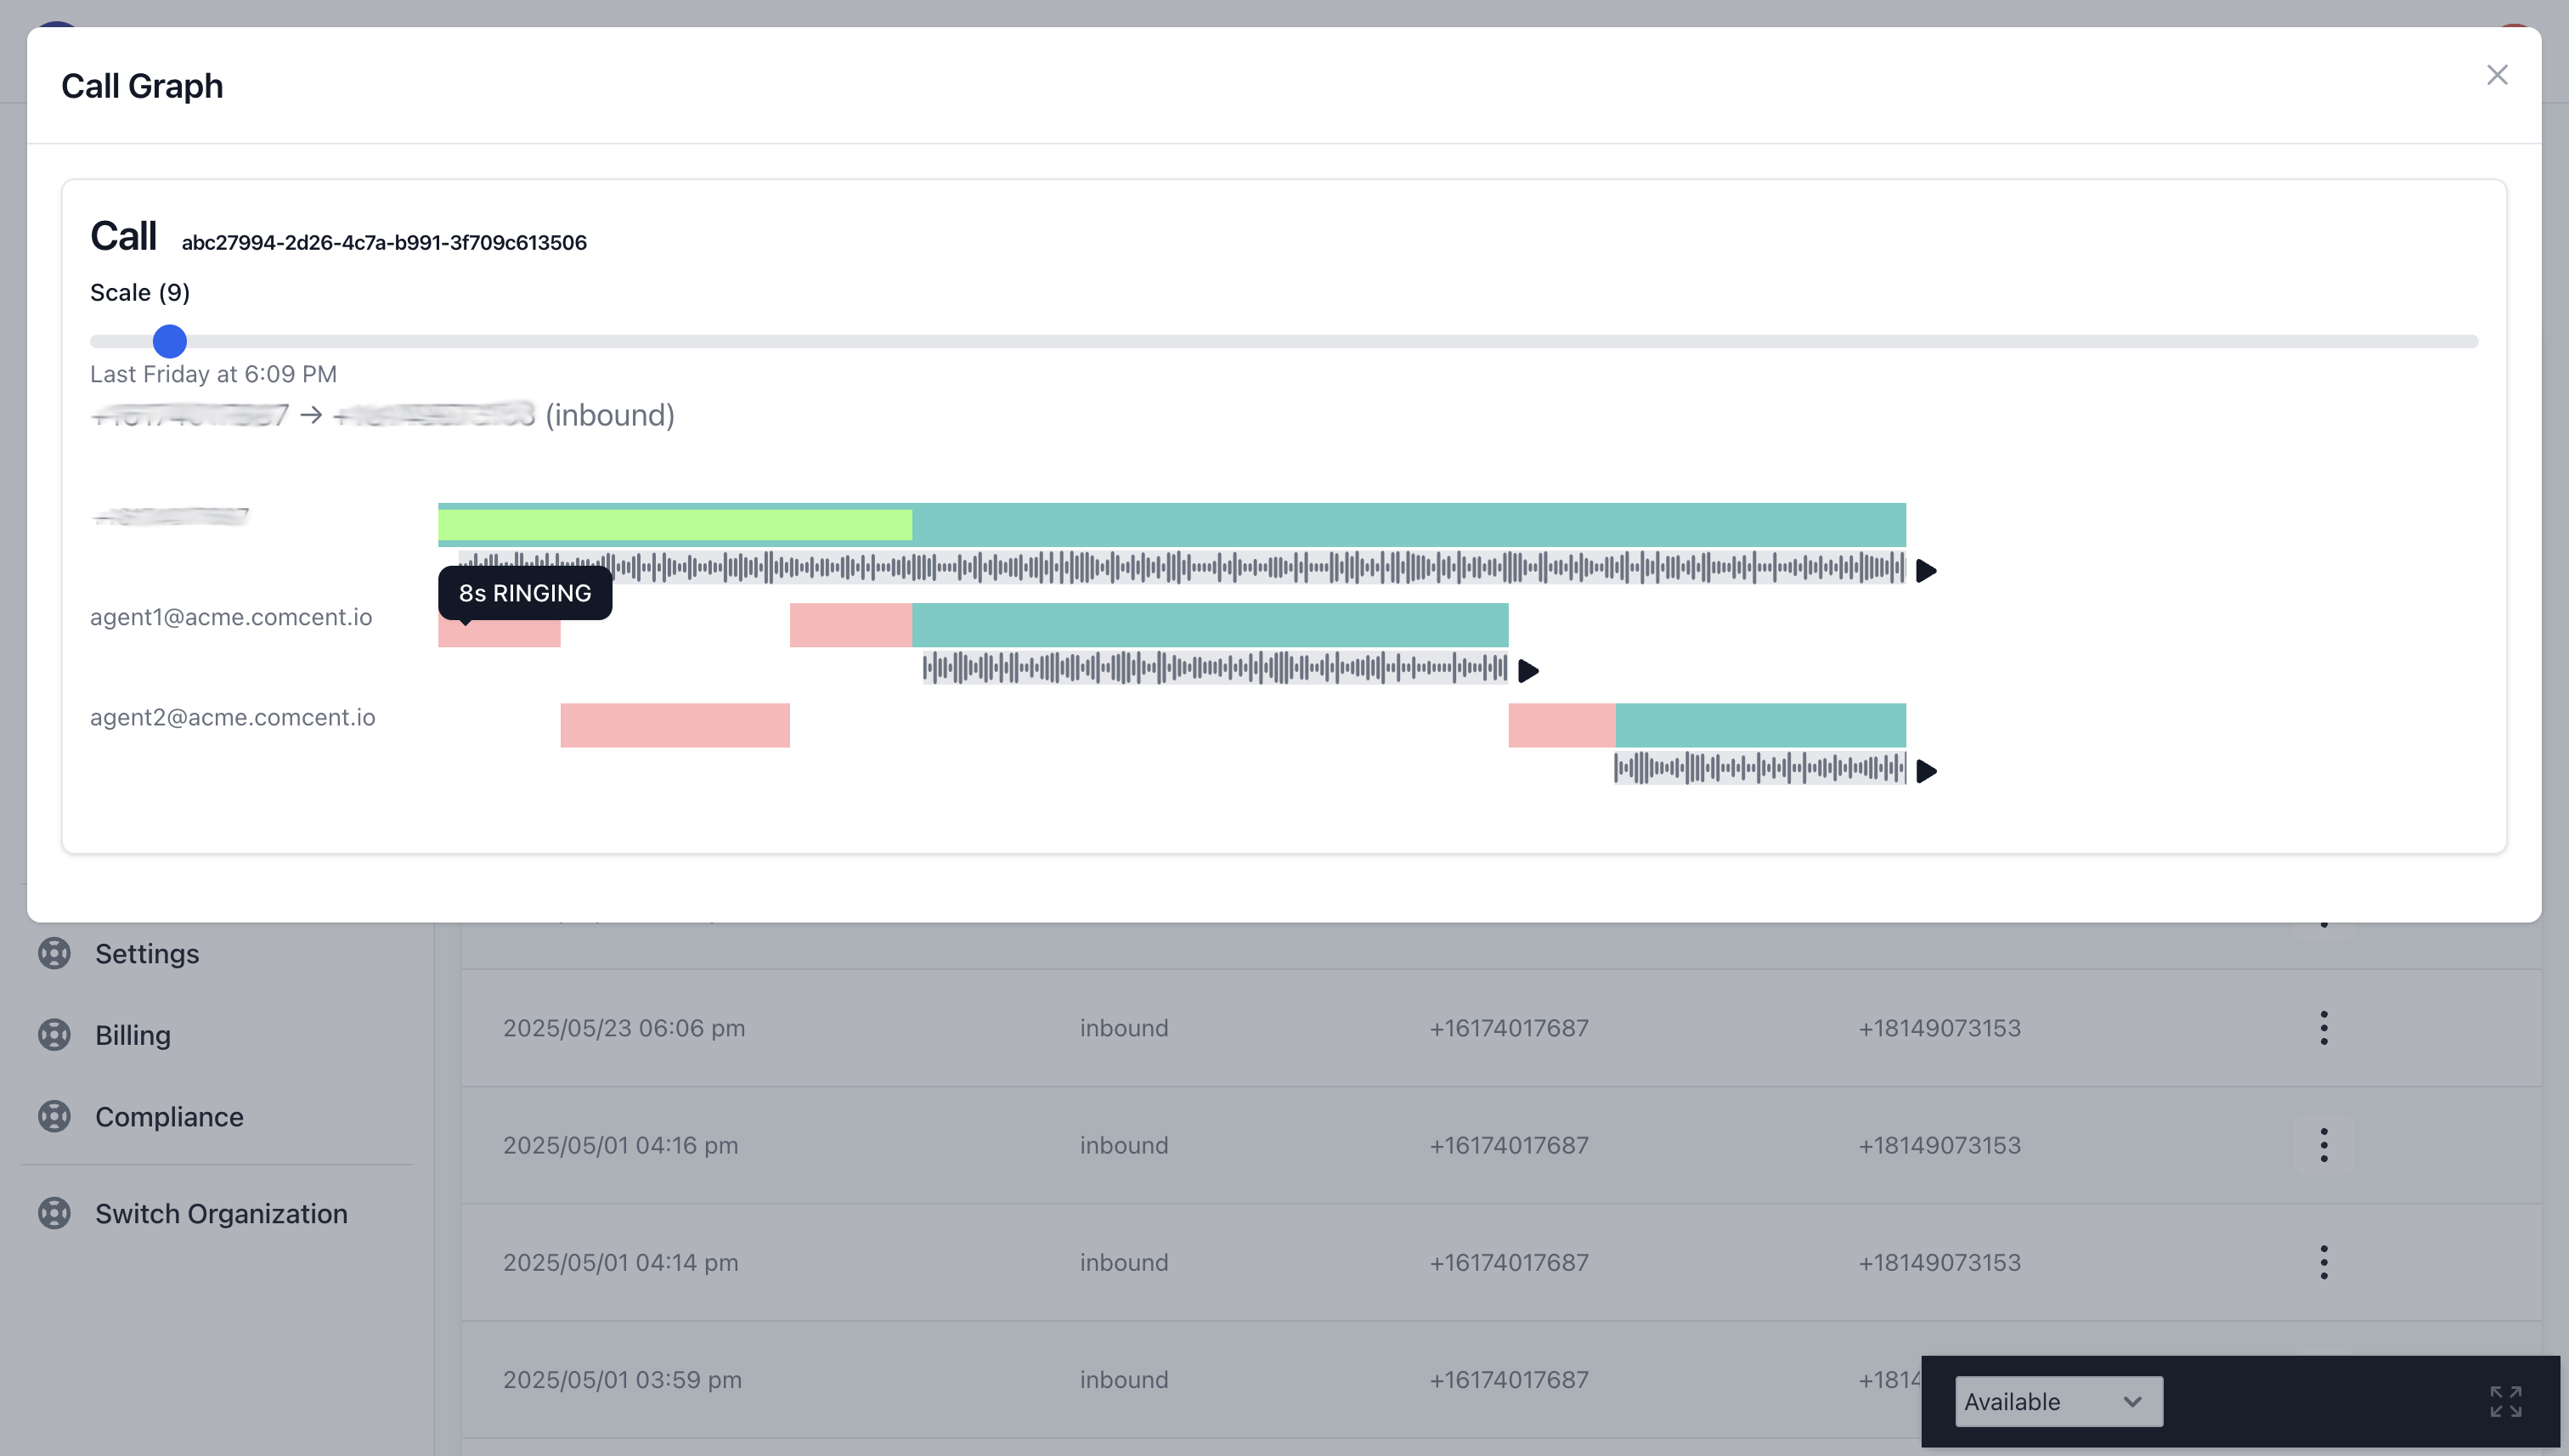
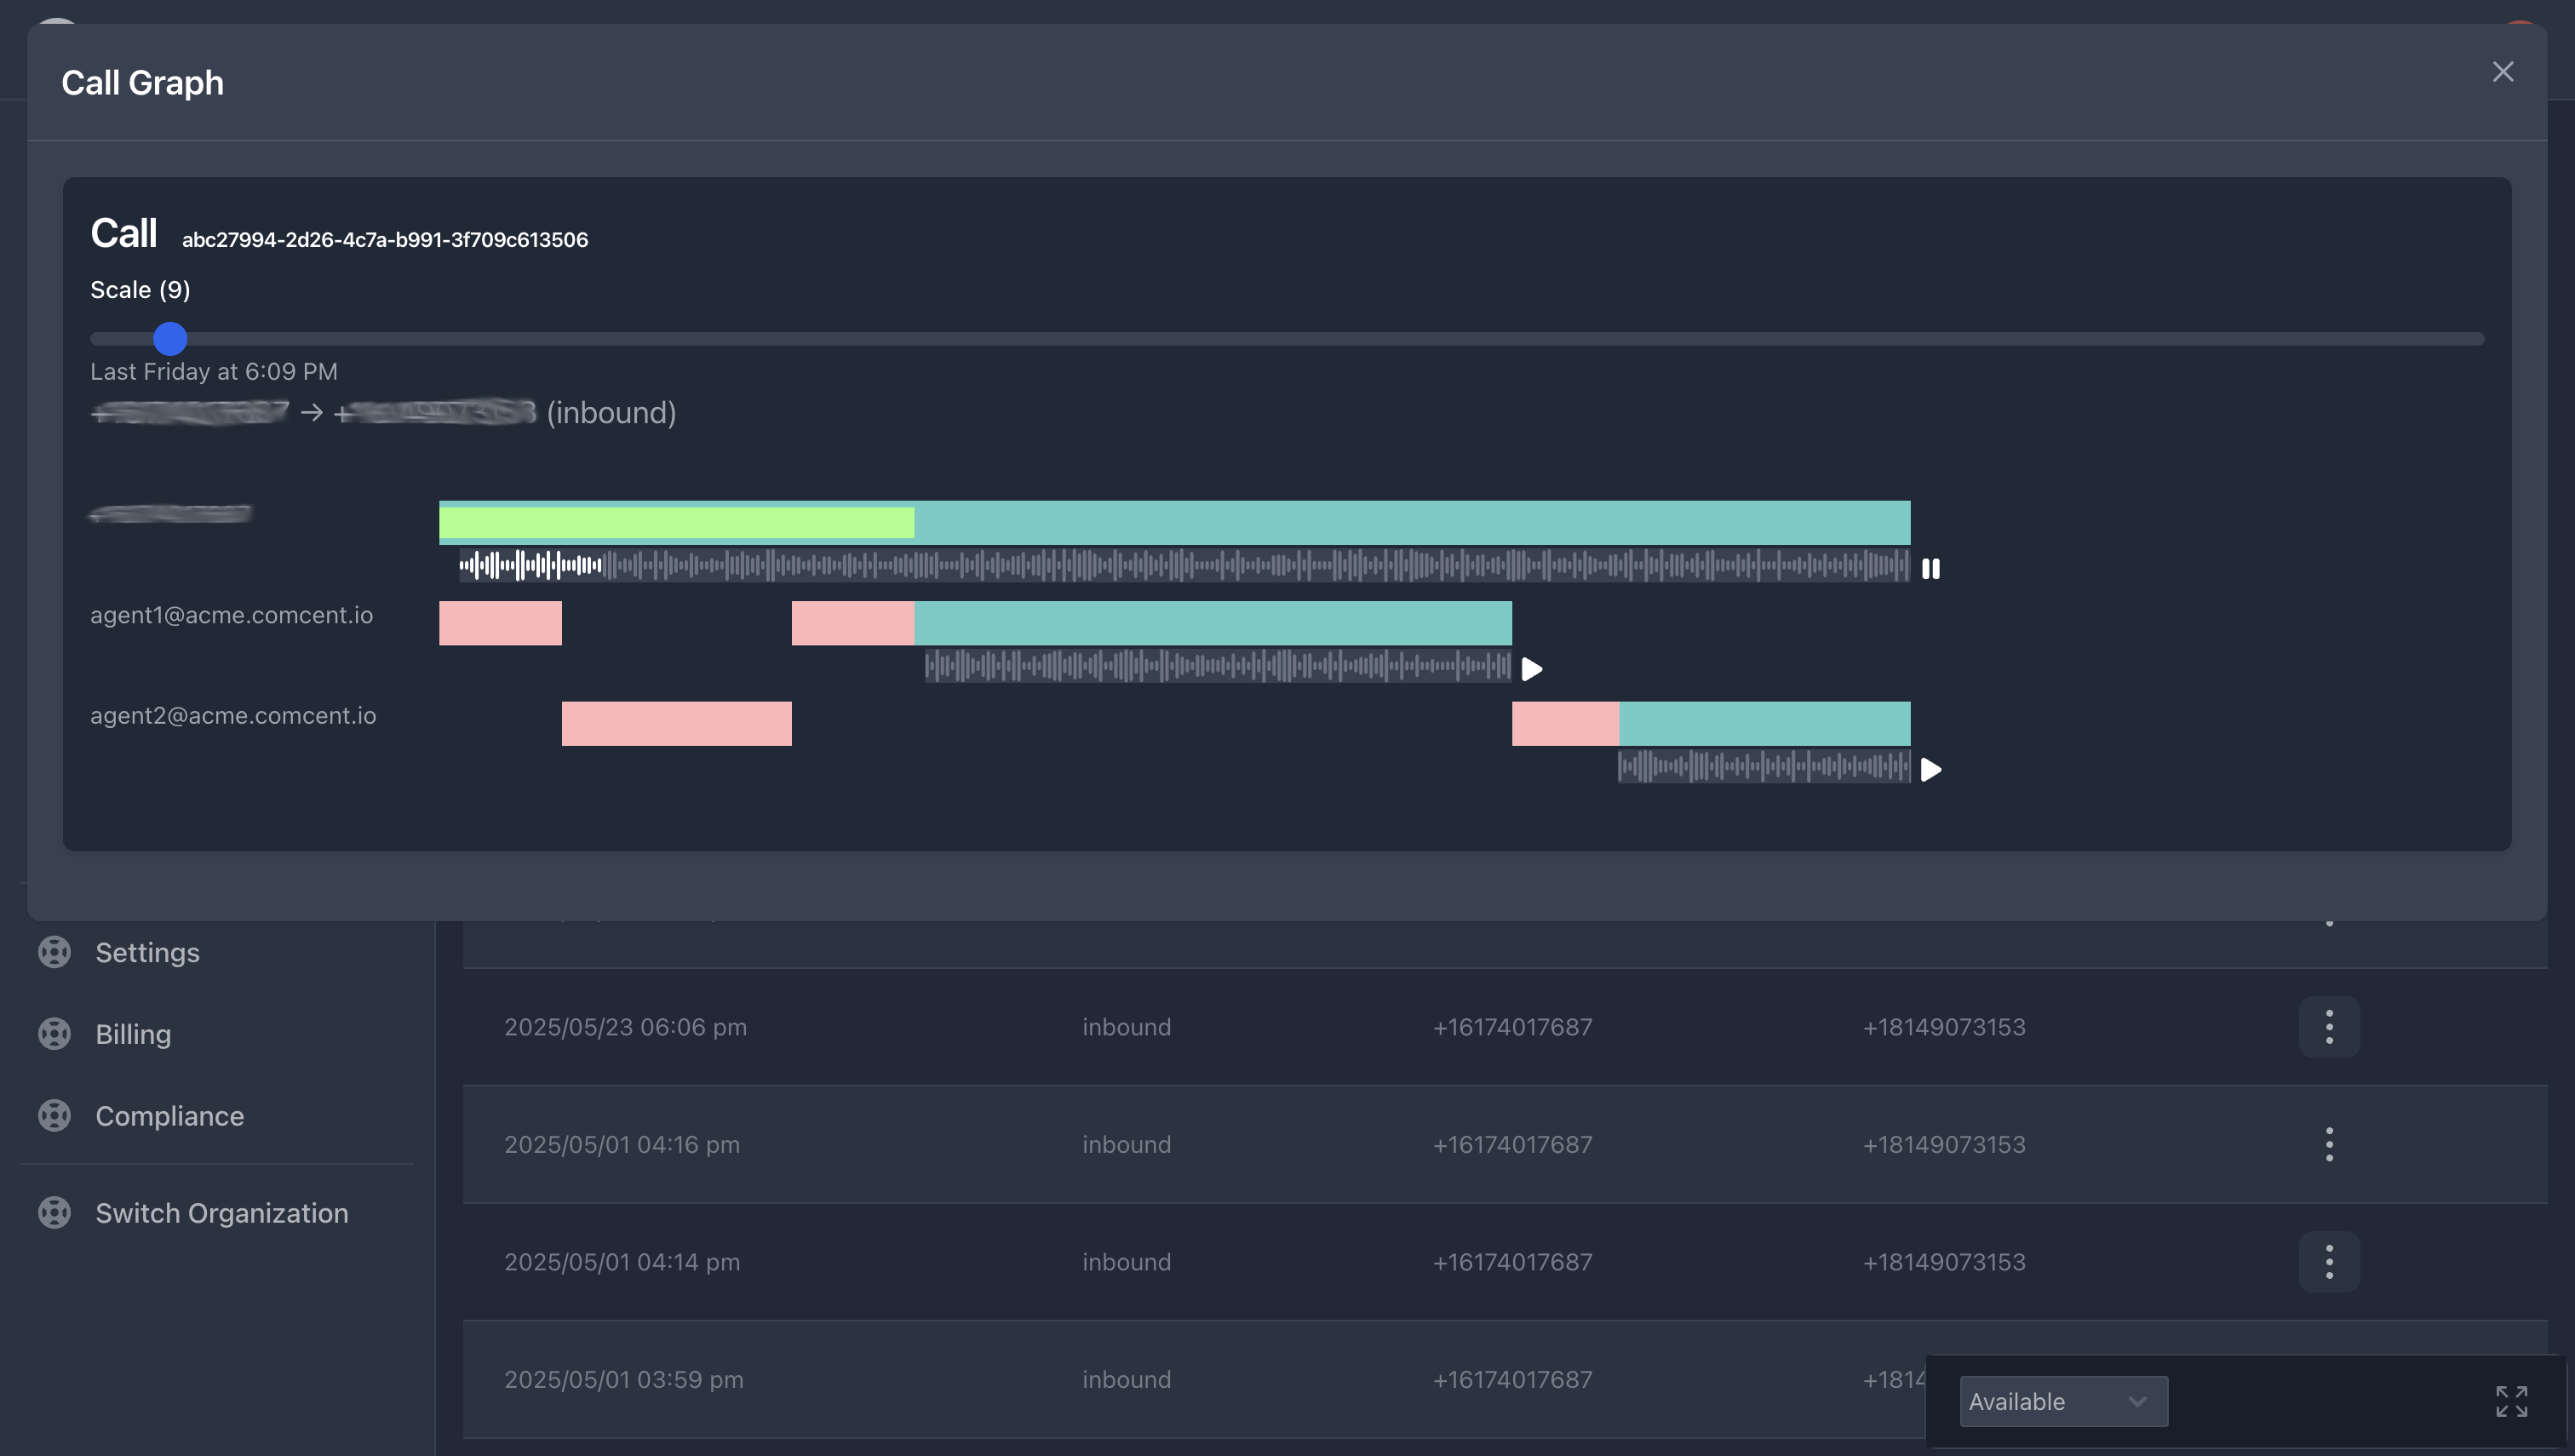
The system then returned to Agent 1, who successfully answered the call, indicated by the aqua color. The conversation lasted 39 seconds. Note that the customer remained on the line after Agent 1 ended the call because the call was transferred to Agent 2. Following a 7-second ring time, Agent 2 answered, and the conversation continued for 19 seconds.
In addition to the visual representation, you can access call recordings. Each recording provides a different participant’s perspective, allowing you to experience both the customer’s journey and each agent’s interaction.

This concludes our overview of the call graph functionality. We hope this guide proves valuable for your call center operations.
Self-host Comcent to explore call graphs and other powerful features. Get started or contact us for managed hosting.